Unlock a world of possibilities! Login now and discover the exclusive benefits awaiting you.
- Qlik Community
- :
- All Forums
- :
- QlikView App Dev
- :
- Using AGGR to calculate Like for like (LFL)
- Subscribe to RSS Feed
- Mark Topic as New
- Mark Topic as Read
- Float this Topic for Current User
- Bookmark
- Subscribe
- Mute
- Printer Friendly Page
- Mark as New
- Bookmark
- Subscribe
- Mute
- Subscribe to RSS Feed
- Permalink
- Report Inappropriate Content
Using AGGR to calculate Like for like (LFL)

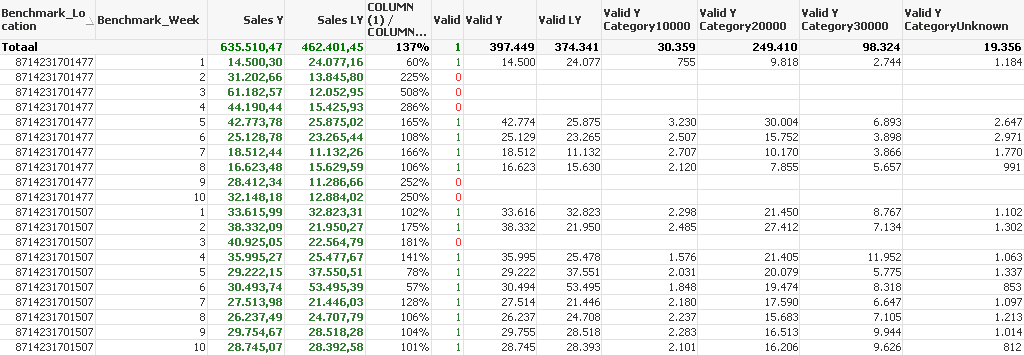
I'm using AGGR conditions to determine if Sales Y vs LY is valid.
MAX diff in sales Y vs LY is 0,75 per Location/Week.
I only want to use the valid weeks for the locations.
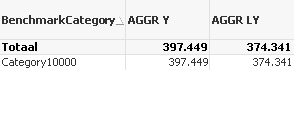
I've managed to make AGGR for a Top level, but when a make a chart with a Category dimension the numbers are not what they should be.

This should be:
See attachment for example QVW.
Accepted Solutions
- Mark as New
- Bookmark
- Subscribe
- Mute
- Subscribe to RSS Feed
- Permalink
- Report Inappropriate Content
See attached qvw. I'm not sure your calculations are correct. But that's for you to figure out. If you select a BenchmarkCategory the numbers change quite a bit. Compare the tables to the left and right of the listbox if when you select BenchmarkCategory values.
talk is cheap, supply exceeds demand
- Mark as New
- Bookmark
- Subscribe
- Mute
- Subscribe to RSS Feed
- Permalink
- Report Inappropriate Content
Hi Gysbert,
Tried to implement the solution in the client dashboard, however as you mentioned a selection changes the numbers. Expecially with average calculations.
I've come up with a solution for this problem.
- Add a field Location_Week in the facttable
- Created a variable which used the likeforlike formula to represent all valid location_week combinations in a Set Analysis string format
- Then use this variable in the SA of the formula like SUM({<Year={2013}, $(vValidLocationWeek)>} Sales)
See attached Solution.qvw
Thanks for your help on this.