Unlock a world of possibilities! Login now and discover the exclusive benefits awaiting you.
- Qlik Community
- :
- All Forums
- :
- QlikView App Dev
- :
- Using Edit Module Functions in Pivot Table Express...
- Subscribe to RSS Feed
- Mark Topic as New
- Mark Topic as Read
- Float this Topic for Current User
- Bookmark
- Subscribe
- Mute
- Printer Friendly Page
- Mark as New
- Bookmark
- Subscribe
- Mute
- Subscribe to RSS Feed
- Permalink
- Report Inappropriate Content
Using Edit Module Functions in Pivot Table Expression
Hello
I am a newcomer to QlikView and I've ran into a slight problem.
As part of getting to know the product I have been trying to produce a heat map using a Pivot table and I have been experimenting with ways in which to change the background colour of each cell depending on the value within the cell.
Initially I used the visual queues tab and set the upper an lower limit. This gave me the Green/Yellow/Red but it was not exactly what I was after as I want a gradual shading from Green to yellow, then yellow to red.
So within the Background Color Definition in the Expressions tab of the Pivot Table properties I added the following code to introduce a few more shades.
if(count(StartHour)<500,rgb(00,120,00),
if(count(StartHour)>=500 and Count(StartHour)<1000, rgb(00,150,00),
if(count(StartHour)>=1000 and Count(StartHour)<1500, rgb(00,255,00),
if(count(StartHour)>=1500 and Count(StartHour)<2000, rgb(128,255,00),
if(count(StartHour)>=2000 and Count(StartHour)<3000, rgb(255,255,00),
if(count(StartHour)>=3000 and Count(StartHour)<4000, rgb(255,244,0),
if(Count(StartHour)>=4000 and Count(StartHour)<4500, rgb(255,213,0),
if(Count(StartHour)>=4500 and Count(StartHour)<5500, rgb(255,128,0),
if(Count(StartHour)>=5500 and Count(StartHour)<6500, rgb(255,103,0), rgb(255,0,0) )))))))))
This now looks a bit better but I thought it might be a bit more interesting to create a custom function within the edit module. And here is where my issue lies. I can use these functions from within the script editor when I'm loading data, but I can't use these functions from with any of the expression fields in the pivot table properties. Having tried a few other things like text boxes, I can't get the functions in the edit module to work from any expression field.
This is my Function (VBScript):
Function GetRedShade (processValue)
REM Return a red shade for the heat map pivot table
DIM redValue
DIM percent, shadeFactor
if processValue < 1500 then
redvalue = "00"
elseif processValue >=1500 and processValue < 2000 then
percent = (processValue/1999)*100
shadeFactor = (255-128)/100
redValue = (percent*shadeFactor)+128
else
redValue = 255
end if
GetRedShade = redValue
end function
So when I call this from the background color definition field like this
rgb(GetRedShade(Count(StartHour)), GetGreenShade(Count(StartHour)), 0)
I get Error in expression. So can anybody help?
Accepted Solutions
- Mark as New
- Bookmark
- Subscribe
- Mute
- Subscribe to RSS Feed
- Permalink
- Report Inappropriate Content
Menu --> Help --> About QlikView --> right click on qlik-symbol in bottom left corner
talk is cheap, supply exceeds demand
- Mark as New
- Bookmark
- Subscribe
- Mute
- Subscribe to RSS Feed
- Permalink
- Report Inappropriate Content
No, you can't use macro's in chart expressions. Well, at least not without changing an easter egg setting called AllowMacroFunctionsInExpressions. But this is obviously not recommended or it would be allowed by default.
Why can't you use variables?
vShadeFactor: (255-128)/100
eCSH: count(StartHour)
ePercent: ($1/1999)*100
eRed: if( $(eCSH)< 1500, 0, if( $(eCSH)<2000, 128+$(vShadeFactor)*$(ePercent($(eCSH))) , 255))
eGreen: ....
eBlue: ....
cBackGround: RGB( $(eRed), $(eGreen), $(eBlue))
talk is cheap, supply exceeds demand
- Mark as New
- Bookmark
- Subscribe
- Mute
- Subscribe to RSS Feed
- Permalink
- Report Inappropriate Content
Thanks Gysbert.
Using Variables will make my initial attempt look a bit cleaner but won't provide the shading I'm after.
How do I change easter egg settings as I'm all for doing things that are not recommended?
Regards
Neil
- Mark as New
- Bookmark
- Subscribe
- Mute
- Subscribe to RSS Feed
- Permalink
- Report Inappropriate Content
Menu --> Help --> About QlikView --> right click on qlik-symbol in bottom left corner
talk is cheap, supply exceeds demand
- Mark as New
- Bookmark
- Subscribe
- Mute
- Subscribe to RSS Feed
- Permalink
- Report Inappropriate Content
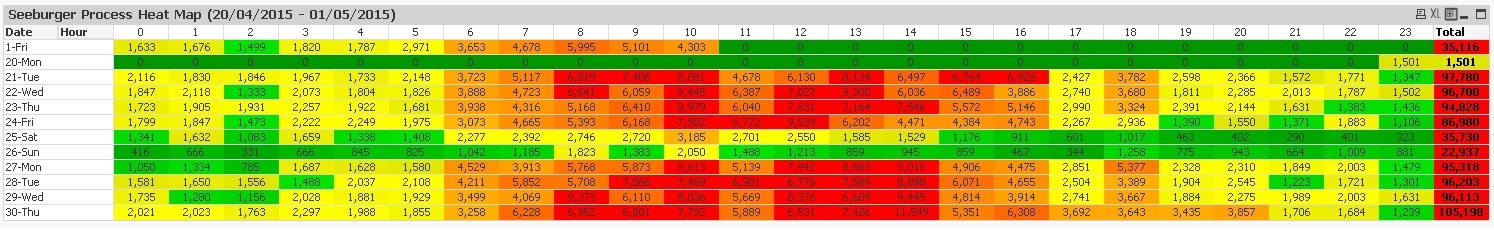
Result
Many Thanks
- Mark as New
- Bookmark
- Subscribe
- Mute
- Subscribe to RSS Feed
- Permalink
- Report Inappropriate Content
Well, it's certainly colorful. I think I'd try more muted colors. It's a bit of an eyesore to me to be honest. And I'd probably give the ColorMix Wizard a go first.
talk is cheap, supply exceeds demand