Unlock a world of possibilities! Login now and discover the exclusive benefits awaiting you.
- Qlik Community
- :
- All Forums
- :
- QlikView App Dev
- :
- Using FirstSortedValue in Set Analysis
- Subscribe to RSS Feed
- Mark Topic as New
- Mark Topic as Read
- Float this Topic for Current User
- Bookmark
- Subscribe
- Mute
- Printer Friendly Page
- Mark as New
- Bookmark
- Subscribe
- Mute
- Subscribe to RSS Feed
- Permalink
- Report Inappropriate Content
Using FirstSortedValue in Set Analysis
Hi,
I'm trying to use the result of a FirstSortedValue function within a set analysis expression to be able to Sum the values in a dimension for the latest week within a particular month or quarter, as below:
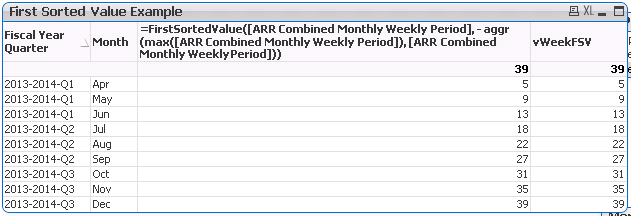
As you can see I'm getting the correct week number both when I explicitly define the function and when I use the variable vWeekFSV in the definition. The problem I've got is when I try to use the either the explicit function or the variable as set analysis in a sum expression, as seen below:
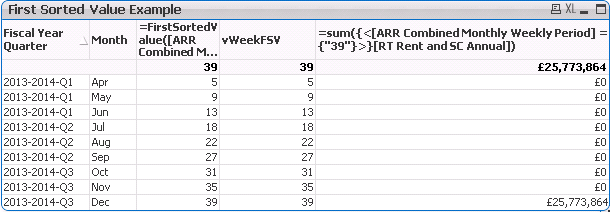
The total for December is correct however, I wanted numbers for the other months too. It looks to me that the set analysis is not being modified by month, and is only calculating once for the last value in the chart. The variable I've used is as follows:
FirstSortedValue([ARR Combined Monthly Weekly Period], - aggr(max([ARR Combined Monthly Weekly Period]), [ARR Combined Monthly Weekly Period]))
and I've included it in the chart expression, as thus:
=sum({<[ARR Combined Monthly Weekly Period] = {"$(=$(vWeekFSV))"}>}[RT Rent and SC Annual])
I'm happy to explore alternative ways of achieving the same result but on the face of it the set analysis route should be working.
Any help gratefully appreciated.
Thanks
George
- Mark as New
- Bookmark
- Subscribe
- Mute
- Subscribe to RSS Feed
- Permalink
- Report Inappropriate Content
Variables are not expanded row-by-row of your graph, that´s why it´s not working
- Mark as New
- Bookmark
- Subscribe
- Mute
- Subscribe to RSS Feed
- Permalink
- Report Inappropriate Content
Hi Anjos,
Thanks for your swift response, but when I put the variable on the chart it does expand it row by row, it's just not working in the Set Analysis. Is this correct functionality?
- Mark as New
- Bookmark
- Subscribe
- Mute
- Subscribe to RSS Feed
- Permalink
- Report Inappropriate Content
Yes, check at the header of your last column. Can you see a "39" there? QlikView is calculating the value for the whole set and returning only to last row