Unlock a world of possibilities! Login now and discover the exclusive benefits awaiting you.
- Qlik Community
- :
- All Forums
- :
- QlikView App Dev
- :
- Re: Using dimensions with expressions
- Subscribe to RSS Feed
- Mark Topic as New
- Mark Topic as Read
- Float this Topic for Current User
- Bookmark
- Subscribe
- Mute
- Printer Friendly Page
- Mark as New
- Bookmark
- Subscribe
- Mute
- Subscribe to RSS Feed
- Permalink
- Report Inappropriate Content
Using dimensions with expressions
Hi,
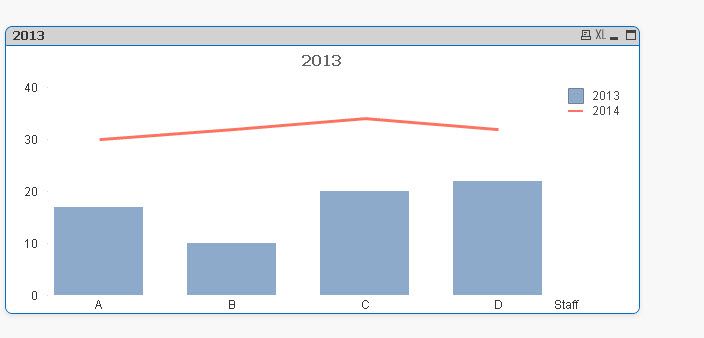
I have the following dimensions: Year (including 2013 and 2014), staff type and total (cost). I would like to create a combo chart that allows me to compare the average costs by staff type for both 2014 (bar) and 2013 (line). How do I write these expressions? I have tried but keep failing (my sql skills not so hot).
Also, can someone point me to where I can find how to write these expressions - that would be much appreciated
Regards,
Simon
- Tags:
- new_to_qlikview
- Mark as New
- Bookmark
- Subscribe
- Mute
- Subscribe to RSS Feed
- Permalink
- Report Inappropriate Content
Dimension as Staff
Create two expression
avg({<Year={2013}>}Cost)
avg({<Year={2014}>}Cost)
Look here for tutorials:
- Mark as New
- Bookmark
- Subscribe
- Mute
- Subscribe to RSS Feed
- Permalink
- Report Inappropriate Content
You can do the following:
1.Select chart -->Bar/Line chart or use a Fast Type change
2. Add Staff_Type and Year as Dimensions
3. write expression Avg(Cost)
- Mark as New
- Bookmark
- Subscribe
- Mute
- Subscribe to RSS Feed
- Permalink
- Report Inappropriate Content
hi simon.ijas
try this expressions by using set analysis
avg({<Year={2013}>}Cost)
avg({<Year={2014}>}Cost)
- Mark as New
- Bookmark
- Subscribe
- Mute
- Subscribe to RSS Feed
- Permalink
- Report Inappropriate Content
Hi,
Use the expressions as below,
avg({<Year={2014}>}cost)------------make this as first expression to get 2014 as BAR
avg({<Year={2013}>}cost)------------make this as second expression to get 2013 as LINE
- Mark as New
- Bookmark
- Subscribe
- Mute
- Subscribe to RSS Feed
- Permalink
- Report Inappropriate Content
Thanks Robert - that is great. Thanks also for the guidance on the tutorials.
Thanks to everyone else too!
Cheers,
Simon