Unlock a world of possibilities! Login now and discover the exclusive benefits awaiting you.
Announcements
FLASH SALE: Save $500! Use code FLASH2026 at checkout until Feb 14th at 11:59PM ET. Register Now!
- Qlik Community
- :
- All Forums
- :
- QlikView App Dev
- :
- Re: Value Distribution Scatter
Options
- Subscribe to RSS Feed
- Mark Topic as New
- Mark Topic as Read
- Float this Topic for Current User
- Bookmark
- Subscribe
- Mute
- Printer Friendly Page
Turn on suggestions
Auto-suggest helps you quickly narrow down your search results by suggesting possible matches as you type.
Showing results for
Not applicable
2015-10-27
02:25 PM
- Mark as New
- Bookmark
- Subscribe
- Mute
- Subscribe to RSS Feed
- Permalink
- Report Inappropriate Content
Value Distribution Scatter
Hi all,
is there a way to get the following chart in QV:
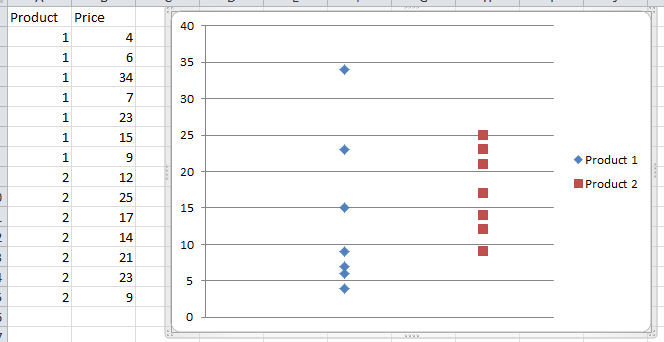
X axis Dimension should be something like Product, Country, Customer, etc.
On the Y axis I want to show the distribution of values like Price, Cost, Quantity (per Order), etc..
I am using a Boxplot diagram so far, but would like to add the single datapoints.
Thank you in advance!
Best regards
Ludwig
511 Views
1 Solution
Accepted Solutions
Champion III
2015-10-27
02:56 PM
- Mark as New
- Bookmark
- Subscribe
- Mute
- Subscribe to RSS Feed
- Permalink
- Report Inappropriate Content
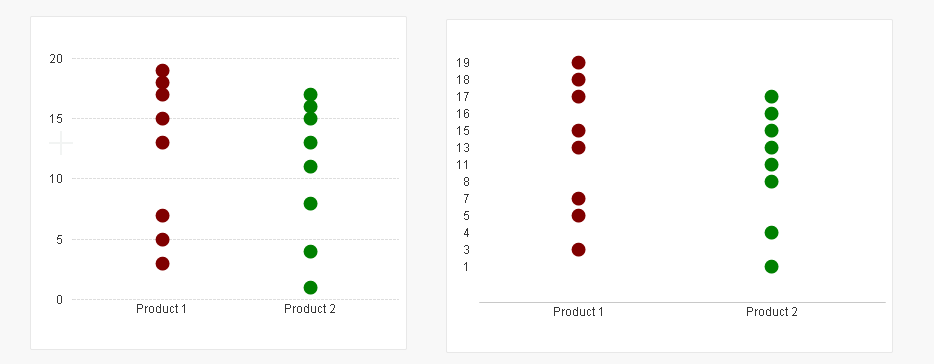
Maybe like attached?
439 Views
4 Replies
Champion III
2015-10-27
02:56 PM
- Mark as New
- Bookmark
- Subscribe
- Mute
- Subscribe to RSS Feed
- Permalink
- Report Inappropriate Content
Maybe like attached?
440 Views
MVP
2015-10-27
03:09 PM
- Mark as New
- Bookmark
- Subscribe
- Mute
- Subscribe to RSS Feed
- Permalink
- Report Inappropriate Content
like this?
Not applicable
2015-10-27
03:12 PM
Author
- Mark as New
- Bookmark
- Subscribe
- Mute
- Subscribe to RSS Feed
- Permalink
- Report Inappropriate Content
Thank you both, I did not think of using a second dimension. Easier than expected!
Best regards
439 Views
Champion III
2015-10-27
03:32 PM
- Mark as New
- Bookmark
- Subscribe
- Mute
- Subscribe to RSS Feed
- Permalink
- Report Inappropriate Content
You are welcome.
Please note the background color attribute expression to get a unique color per product.
439 Views