Unlock a world of possibilities! Login now and discover the exclusive benefits awaiting you.
- Qlik Community
- :
- All Forums
- :
- QlikView App Dev
- :
- ValueList
- Subscribe to RSS Feed
- Mark Topic as New
- Mark Topic as Read
- Float this Topic for Current User
- Bookmark
- Subscribe
- Mute
- Printer Friendly Page
- Mark as New
- Bookmark
- Subscribe
- Mute
- Subscribe to RSS Feed
- Permalink
- Report Inappropriate Content
ValueList
I have below Data
Load * Inline
[
  Customer, Year, Qty, Sales
  A,  2011, 10, 1000
  A,  2012, 20, 2000
  A,  2013, 30, 3000
  A,  2014, 40, 4000
  A,  2015, 50, 5000
  A,  2016, 60, 6000
  A,  2017, 70, 7000
  B,  2011, 15, 1500
  B,  2012, 25, 2500
  B,  2013, 35, 3500
  B,  2014, 45, 4500
  B,  2015, 55, 5500
  B,  2016, 65, 6500
  B,  2017, 75, 7500
];
I want to create a Pivot table with Dynamic Heading
If user select Year then need Header name dynamically...
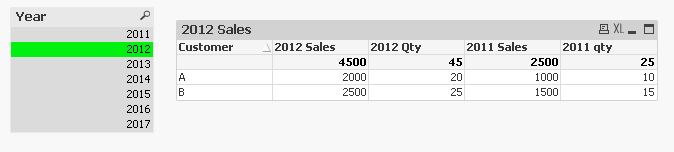
If user select 2012, I need below table
Customer 2012 Sales 2012 Qty 2011 Sale 2011 Qty
A 2000 20 1000 10
B 2500 25 1500 15
Important thing here is Dynamic Header... I don't want Sales and Qty only. I want Year also.
The actual pivot is having many KPIs so, can't do Max(Year) & 'Sales' and Max(Year) & 'Qty'...
Hope I am clear in my question.
I need this by ValueList Function...
Thanks
- Tags:
- new_to_qlikview
- « Previous Replies
- Next Replies »
- Mark as New
- Bookmark
- Subscribe
- Mute
- Subscribe to RSS Feed
- Permalink
- Report Inappropriate Content
Hi,
One option is, create all the expresions and use conditional to show or unshow the expresions based on selecttion Year.
Regards
- Mark as New
- Bookmark
- Subscribe
- Mute
- Subscribe to RSS Feed
- Permalink
- Report Inappropriate Content
Go to Expression Label. Put below Expression
Create Pivot
Dimension: Customer
Expressions :
sum(Sales)
Sum(Qty)
Now for Each Expression Label but below Expression
=Year &' Sales'
=Year &' Qty'
- Mark as New
- Bookmark
- Subscribe
- Mute
- Subscribe to RSS Feed
- Permalink
- Report Inappropriate Content
You could use something like this:
exp: sum({< Year = {"$(=max(Year))"} >} Sales) // current year based on selection
label: = max(Year) & ' Sales'
exp: sum({< Year = {"$(=max(Year) - 1)"} >} Sales) // previous year to curent year
label: = max(Year) - 1 & ' Sales'
- Marcus
- Mark as New
- Bookmark
- Subscribe
- Mute
- Subscribe to RSS Feed
- Permalink
- Report Inappropriate Content
I need solution only by ValueList as there are many KPIs need to be shown and simple expression would not work.
- Mark as New
- Bookmark
- Subscribe
- Mute
- Subscribe to RSS Feed
- Permalink
- Report Inappropriate Content
This?
Look at the attached qvw file.
Best,
Sunny
- Mark as New
- Bookmark
- Subscribe
- Mute
- Subscribe to RSS Feed
- Permalink
- Report Inappropriate Content
Thanks Marcus for your solution but real application is having many KPIs which is not easily shown by the answer given by you.
I need solution only by ValueList function.
- Mark as New
- Bookmark
- Subscribe
- Mute
- Subscribe to RSS Feed
- Permalink
- Report Inappropriate Content
Thanks Sunny but need answer by only ValueList Function...
- Mark as New
- Bookmark
- Subscribe
- Mute
- Subscribe to RSS Feed
- Permalink
- Report Inappropriate Content
Hi,
What do you mean with ValueList function?
GetFieldSelecctons?
Regards
- Mark as New
- Bookmark
- Subscribe
- Mute
- Subscribe to RSS Feed
- Permalink
- Report Inappropriate Content
Not sure I understand? If you have the data setup like this for all your KPIs, why do you have to use ValueList and not the above mentioned approach by all of us?
- « Previous Replies
- Next Replies »