Unlock a world of possibilities! Login now and discover the exclusive benefits awaiting you.
- Qlik Community
- :
- All Forums
- :
- QlikView App Dev
- :
- TrendLines based on count of Dimension values??
- Subscribe to RSS Feed
- Mark Topic as New
- Mark Topic as Read
- Float this Topic for Current User
- Bookmark
- Subscribe
- Mute
- Printer Friendly Page
- Mark as New
- Bookmark
- Subscribe
- Mute
- Subscribe to RSS Feed
- Permalink
- Report Inappropriate Content
TrendLines based on count of Dimension values??
Hello,
I am working on one combo chart with date as dimension and has one expression in it....
Expressions :
SUM
({<IDGRUEMP = {'0022'},IDESCENA={'01'},CODJEN2={'10060000'},ACUMTEMP ={'DAY'},CODJEN4 = {'41180000'},CODFASE ={'99','FR'}>}ISAFCCDP)* 0.000000001
and i want to draw tred line based on the average of the above expression....
i mean if i select 6 dates of the month... the reference line expression shoudl be sum()/6
if i select 25 dates of the any month... the reference line should be sum()/25
I mean the division is based on the number of values or selections in the dimension.
thanks in advance for the great help.
Regards,
Siva
- Tags:
- new_to_qlikview
- « Previous Replies
-
- 1
- 2
- Next Replies »
Accepted Solutions
- Mark as New
- Bookmark
- Subscribe
- Mute
- Subscribe to RSS Feed
- Permalink
- Report Inappropriate Content
I understand now 
May be try this:
=If((Sum({<IDGRUEMP = {'0022'},IDESCENA={'01'},CODJEN2={'10060000'},ACUMTEMP ={'DAY'},CODJEN4={'41180000'},CODFASE={'99','FR'}>}ISAFCCDP)* 0.000000001) <
((Sum(TOTAL {<IDGRUEMP = {'0022'},IDESCENA={'01'},CODJEN2={'10060000'},ACUMTEMP ={'DAY'},CODJEN4={'41180000'},CODFASE={'99','FR'}>}ISAFCCDP)* 0.000000001)/COUNT(TOTAL Distinct FECDATA)), Red(), Green())
- Mark as New
- Bookmark
- Subscribe
- Mute
- Subscribe to RSS Feed
- Permalink
- Report Inappropriate Content
Have you tried this:
Sum({<IDGRUEMP = {'0022'},IDESCENA={'01'},CODJEN2={'10060000'},ACUMTEMP ={'DAY'},CODJEN4 = {'41180000'},CODFASE ={'99','FR'}>}ISAFCCDP)* 0.000000001) / Count(DISTINCT Dates)
- Mark as New
- Bookmark
- Subscribe
- Mute
- Subscribe to RSS Feed
- Permalink
- Report Inappropriate Content
Yes, its working for the trend line... but when i use the same expression in the background Color attribute...its not working against the dimenstion values....
= if(
( SUM({<IDGRUEMP = {'0022'},IDESCENA={'01'},CODJEN2={'10060000'},ACUMTEMP ={'DAY'},CODJEN4={'41180000'},CODFASE={'99','FR'}>}ISAFCCDP)* 0.000000001) <
((sum({<IDGRUEMP = {'0022'},IDESCENA={'01'},CODJEN2={'10060000'},ACUMTEMP ={'DAY'},CODJEN4={'41180000'},CODFASE={'99','FR'}>}ISAFCCDP)* 0.000000001)/COUNT(Distinct FECDATA)), Red(), Green())
Won't this work for background color expressions???
Thanks in advance for all your help..
--Siva
- Mark as New
- Bookmark
- Subscribe
- Mute
- Subscribe to RSS Feed
- Permalink
- Report Inappropriate Content
This condition seems to be always be false and will give you green. You are checking if x < x/y (where y is an integer).
Are you sure you have this the right way??? Please check the expression again.
Best,
Sunny
- Mark as New
- Bookmark
- Subscribe
- Mute
- Subscribe to RSS Feed
- Permalink
- Report Inappropriate Content
x ==>
SUM
({<IDGRUEMP = {'0022'},IDESCENA={'01'},CODJEN2={'10060000'},ACUMTEMP ={'DAY'},CODJEN4 = {'41180000'},CODFASE ={'99','FR'}>}ISAFCCDP)* 0.000000001
This expression is working file in the bar chart expression... giving values based on the dimension...
if i use same expression in backgroundcolor attribute? wont this calculate based on the dimension values???
= if(
( SUM({<IDGRUEMP = {'0022'},IDESCENA={'01'},CODJEN2={'10060000'},ACUMTEMP ={'DAY'},CODJEN4={'41180000'},CODFASE={'99','FR'}>}ISAFCCDP)* 0.000000001) <
((sum({<IDGRUEMP = {'0022'},IDESCENA={'01'},CODJEN2={'10060000'},ACUMTEMP ={'DAY'},CODJEN4={'41180000'},CODFASE={'99','FR'}>}ISAFCCDP)* 0.000000001)/COUNT(Distinct FECDATA)), Red(), Green())
Confused????? Please help.... If this is not possible, do we have any other alternative way to calculate the backupground color of the chart.??
Regards
Siva
- Mark as New
- Bookmark
- Subscribe
- Mute
- Subscribe to RSS Feed
- Permalink
- Report Inappropriate Content
Yes, in background color it should give you the value by dimension also. What I am trying to say is that the condition you are listing will most likely result in a false and must be giving you all greens. Is that true??
To check if what I am saying is right or not. Convert your chart into straight table and add this expression:
=If((Sum({<IDGRUEMP = {'0022'},IDESCENA={'01'},CODJEN2={'10060000'},ACUMTEMP ={'DAY'},CODJEN4={'41180000'},CODFASE={'99','FR'}>}ISAFCCDP)* 0.000000001) <
((Sum({<IDGRUEMP = {'0022'},IDESCENA={'01'},CODJEN2={'10060000'},ACUMTEMP ={'DAY'},CODJEN4={'41180000'},CODFASE={'99','FR'}>}ISAFCCDP)* 0.000000001)/COUNT(Distinct FECDATA)), 1, 0)
If you get 0's for all the rows in the straight table, you will know that the statement is getting evaluated as Green() in Background color.
Does this make sense?
- Mark as New
- Bookmark
- Subscribe
- Mute
- Subscribe to RSS Feed
- Permalink
- Report Inappropriate Content
Yes, you are 100% correct, its giving all zero values in the expression....
- Mark as New
- Bookmark
- Subscribe
- Mute
- Subscribe to RSS Feed
- Permalink
- Report Inappropriate Content
The reason is that you have the condition as x for each dimension is less than x/count. x/count will most likely be less than x, right??? If you give more idea about what you are trying to do, we can may be improve your if statement here.
I hope that makes sense.
Best,
Sunny
- Mark as New
- Bookmark
- Subscribe
- Mute
- Subscribe to RSS Feed
- Permalink
- Report Inappropriate Content
Thanks for your quick reply... Please check the following screent shot here for the first graph.... i have created the trendline...
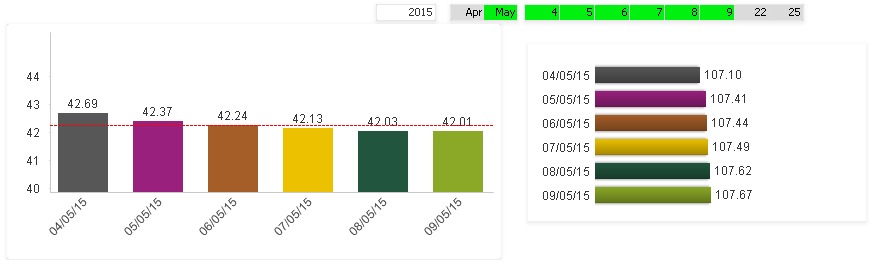
Bar chart Expression is :
$(vRA_SVRMortgages)
====>
Where variable vRA_SVRMortgages===>
SUM
({<IDGRUEMP = {'0022'},IDESCENA={'01'},CODJEN2={'10060000'},ACUMTEMP ={'DAY'},CODJEN4 = {'41180000'},CODFASE ={'99','FR'}>}ISAFCCDP)* 0.000000001
Reference Lines Exporession is :
$(vRA_SVRMortgages)/COUNT(Distinct FECDATA)
The background color of the chart expressions is :
=if(($(vRA_SVRMortgages)/COUNT(Distinct FECDATA)) > $(vRA_SVRMortgages), Red(),Green())
i want to show the background color of bars is red or green based on value of reference line...
1> if bar is above the reference line, then bgcolor of the bar should be green
2> if the bar is below the reference line, then bgcolor of the bar should be red
- Mark as New
- Bookmark
- Subscribe
- Mute
- Subscribe to RSS Feed
- Permalink
- Report Inappropriate Content
I understand now
May be try this:
=If((Sum({<IDGRUEMP = {'0022'},IDESCENA={'01'},CODJEN2={'10060000'},ACUMTEMP ={'DAY'},CODJEN4={'41180000'},CODFASE={'99','FR'}>}ISAFCCDP)* 0.000000001) <
((Sum(TOTAL {<IDGRUEMP = {'0022'},IDESCENA={'01'},CODJEN2={'10060000'},ACUMTEMP ={'DAY'},CODJEN4={'41180000'},CODFASE={'99','FR'}>}ISAFCCDP)* 0.000000001)/COUNT(TOTAL Distinct FECDATA)), Red(), Green())
- « Previous Replies
-
- 1
- 2
- Next Replies »