Unlock a world of possibilities! Login now and discover the exclusive benefits awaiting you.
- Qlik Community
- :
- All Forums
- :
- QlikView App Dev
- :
- Re: Values below the axes in a graph
- Subscribe to RSS Feed
- Mark Topic as New
- Mark Topic as Read
- Float this Topic for Current User
- Bookmark
- Subscribe
- Mute
- Printer Friendly Page
- Mark as New
- Bookmark
- Subscribe
- Mute
- Subscribe to RSS Feed
- Permalink
- Report Inappropriate Content
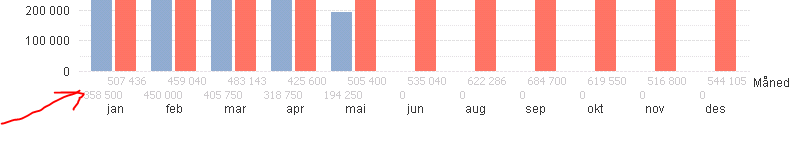
Values below the axes in a graph
Hi all,
Anyone who knows if it is possible to change the colour of the values below the axes in QlikView? I want to visualize the values below the axes in a more visible way. I know we can present the values inside the graph but that is not an option in this case.
If is not possible, anyone who knows a second method? I have also tried a straight table, it does not seems like an appropriate solution, the values are not synchronised with the bars.
I am using month as a dimension and two expressions.
Accepted Solutions
- Mark as New
- Bookmark
- Subscribe
- Mute
- Subscribe to RSS Feed
- Permalink
- Report Inappropriate Content
Hi
Try like this
Please close the thread by marking correct answer & give likes if you like the post.
- Mark as New
- Bookmark
- Subscribe
- Mute
- Subscribe to RSS Feed
- Permalink
- Report Inappropriate Content
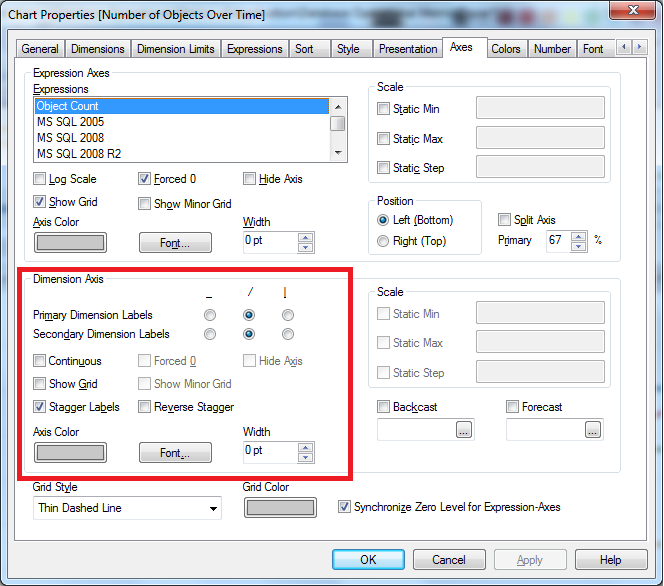
In the Chart properties, under the Axes tab you can modify the font in the Expression Axis section.
Updated screenshot:
- Mark as New
- Bookmark
- Subscribe
- Mute
- Subscribe to RSS Feed
- Permalink
- Report Inappropriate Content
 HI Jon,
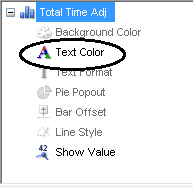
Yes, you can do it. In the expression u see a + mark > click on it and you will see text color > here specif the color
- Mark as New
- Bookmark
- Subscribe
- Mute
- Subscribe to RSS Feed
- Permalink
- Report Inappropriate Content
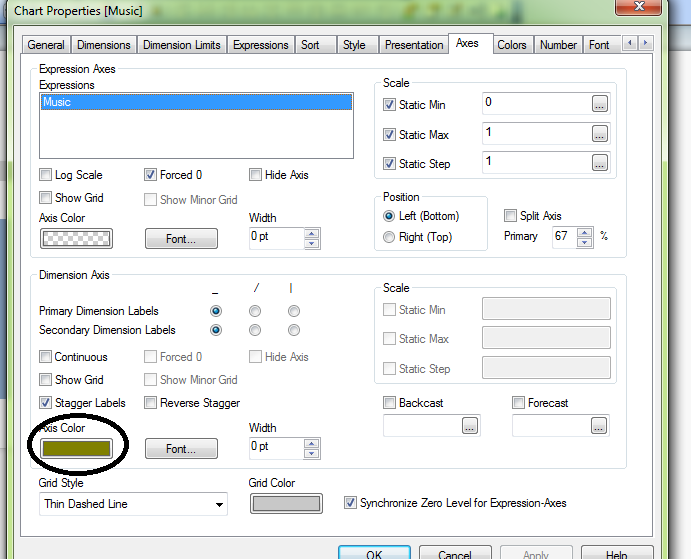
Under the axes tab (in properties of the chart) you could try to slant the labels so that they line up a little easier, that could be a viable option for you.
In the same tab, under the "dimension axis" category you can change the font color
- Mark as New
- Bookmark
- Subscribe
- Mute
- Subscribe to RSS Feed
- Permalink
- Report Inappropriate Content
Hi
Try like this
Please close the thread by marking correct answer & give likes if you like the post.
- Mark as New
- Bookmark
- Subscribe
- Mute
- Subscribe to RSS Feed
- Permalink
- Report Inappropriate Content
Hi Jon,
Avinash R answer is correct
Textcolor it will work......
regards,
Niranjan