Unlock a world of possibilities! Login now and discover the exclusive benefits awaiting you.
- Qlik Community
- :
- All Forums
- :
- QlikView App Dev
- :
- Re: Re: Values on Datapoints in a pier chart makes...
- Subscribe to RSS Feed
- Mark Topic as New
- Mark Topic as Read
- Float this Topic for Current User
- Bookmark
- Subscribe
- Mute
- Printer Friendly Page
- Mark as New
- Bookmark
- Subscribe
- Mute
- Subscribe to RSS Feed
- Permalink
- Report Inappropriate Content
Values on Datapoints in a pier chart makes the chart size small
Hi,
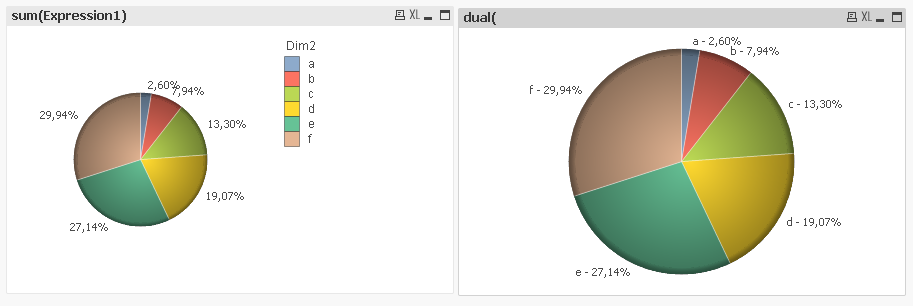
I am trying to create a pie chart and it shows up in a big size,however if i select values on data points to see the % values , the chart becomes small, i looked at all the options to make the chart larger, but nothing works out. Am i missing something?
Thanks
- « Previous Replies
-
- 1
- 2
- Next Replies »
- Mark as New
- Bookmark
- Subscribe
- Mute
- Subscribe to RSS Feed
- Permalink
- Report Inappropriate Content
That was what I was saying
- Mark as New
- Bookmark
- Subscribe
- Mute
- Subscribe to RSS Feed
- Permalink
- Report Inappropriate Content
Hi Florian,
Shift+Ctrl did work.Thanks
- Mark as New
- Bookmark
- Subscribe
- Mute
- Subscribe to RSS Feed
- Permalink
- Report Inappropriate Content
Hi Anjois,
Dual also worked fine, but as per my requirement i am going with the way florian suggested.Thanks for your help.
- Mark as New
- Bookmark
- Subscribe
- Mute
- Subscribe to RSS Feed
- Permalink
- Report Inappropriate Content
Hi Anjos,
My requirement changed to use dual and as i am using your example i did exactly the same but not able to achieve the end result attached is my QVW, Can you take a look at it please?
Thanks
- Mark as New
- Bookmark
- Subscribe
- Mute
- Subscribe to RSS Feed
- Permalink
- Report Inappropriate Content
Just a few fixes:
At Expressions tab
1) Change your expression to :
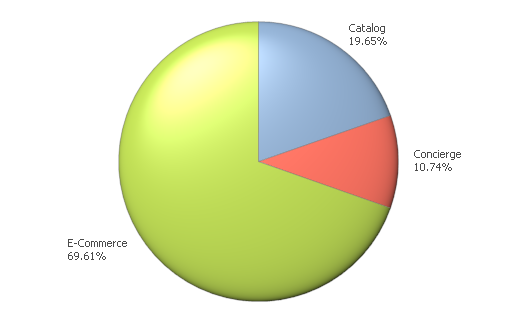
dual(
[Transaction Channel Desc] & '-' & num(sum([Gross Demand $])/sum(total [Gross Demand $]),'#,##0.00%'),
sum([Gross Demand $])
2) Uncheck "Relative"
At Number Tab
Check "Expression Default"
- Mark as New
- Bookmark
- Subscribe
- Mute
- Subscribe to RSS Feed
- Permalink
- Report Inappropriate Content
hi Anjos,
I tried doing what you said now nothing shows up in the chart, it says no data to display? Can you please update the QVW i sent and forward it to me?
Thanks
- Mark as New
- Bookmark
- Subscribe
- Mute
- Subscribe to RSS Feed
- Permalink
- Report Inappropriate Content
Of course,I´ve done a small reduction only to get a smaller qvw, please reload it
- Mark as New
- Bookmark
- Subscribe
- Mute
- Subscribe to RSS Feed
- Permalink
- Report Inappropriate Content
Hi Anjos,
Perfect,Thanks
- « Previous Replies
-
- 1
- 2
- Next Replies »