Unlock a world of possibilities! Login now and discover the exclusive benefits awaiting you.
- Qlik Community
- :
- All Forums
- :
- QlikView App Dev
- :
- Re: Values on data points
- Subscribe to RSS Feed
- Mark Topic as New
- Mark Topic as Read
- Float this Topic for Current User
- Bookmark
- Subscribe
- Mute
- Printer Friendly Page
- Mark as New
- Bookmark
- Subscribe
- Mute
- Subscribe to RSS Feed
- Permalink
- Report Inappropriate Content
Values on data points
Hello everyone,
I have the following combined chárt and I cant show the values on data points of the line charts
The expression to the chart line is: ={$(vPeriodoNumMax)}>}TXS_inco2_detalle)/sum({<PeriodoNum ={$(vPeriodoNumMax)}>}TXS_inco2_detalle)
I would appreciate if you could help me
Kind Regards
Accepted Solutions
- Mark as New
- Bookmark
- Subscribe
- Mute
- Subscribe to RSS Feed
- Permalink
- Report Inappropriate Content
It could be that adding another dimension puts the number of datapoints over the limit for when Values on data points are displayed. You can increase the maximum number of datapoints for which values are shown under "Chart Properties/Presentation".
- Mark as New
- Bookmark
- Subscribe
- Mute
- Subscribe to RSS Feed
- Permalink
- Report Inappropriate Content
What happens when you select 'Values on Data Points' option? It shows nothing?
- Mark as New
- Bookmark
- Subscribe
- Mute
- Subscribe to RSS Feed
- Permalink
- Report Inappropriate Content
Yes, I have selected values on data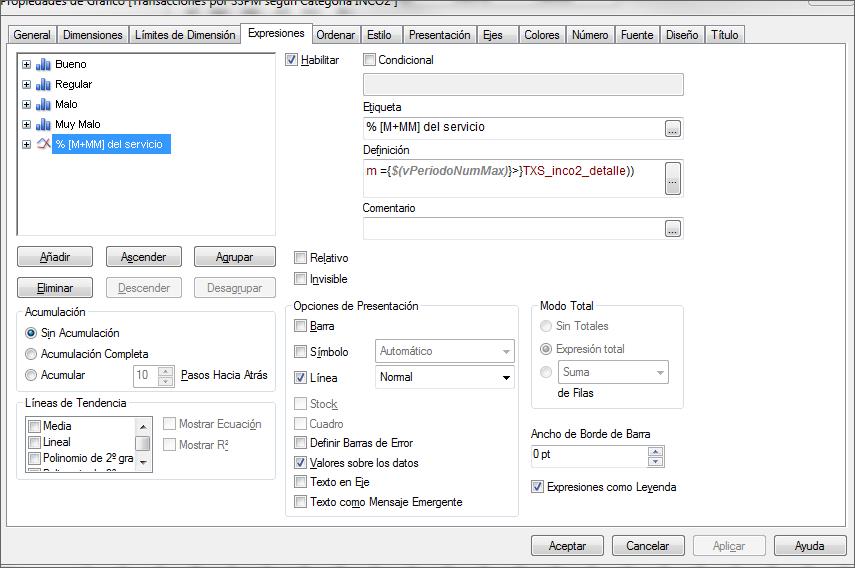
- Mark as New
- Bookmark
- Subscribe
- Mute
- Subscribe to RSS Feed
- Permalink
- Report Inappropriate Content
It could be that adding another dimension puts the number of datapoints over the limit for when Values on data points are displayed. You can increase the maximum number of datapoints for which values are shown under "Chart Properties/Presentation".
- Mark as New
- Bookmark
- Subscribe
- Mute
- Subscribe to RSS Feed
- Permalink
- Report Inappropriate Content
yes, you are right, with that i can solve the problem!! Thank you!
- Mark as New
- Bookmark
- Subscribe
- Mute
- Subscribe to RSS Feed
- Permalink
- Report Inappropriate Content
How can change the size of the fonts labels over data?