Unlock a world of possibilities! Login now and discover the exclusive benefits awaiting you.
- Qlik Community
- :
- All Forums
- :
- QlikView App Dev
- :
- Re: Values on the top of the line and down
- Subscribe to RSS Feed
- Mark Topic as New
- Mark Topic as Read
- Float this Topic for Current User
- Bookmark
- Subscribe
- Mute
- Printer Friendly Page
- Mark as New
- Bookmark
- Subscribe
- Mute
- Subscribe to RSS Feed
- Permalink
- Report Inappropriate Content
Values on the top of the line and down
Hi look at picture, i have this kind of chart, i want put for the first line the value on the Top (relative to the line) and for se second line the value Down (relative to the line) otherwise i can't read all values, is possible?
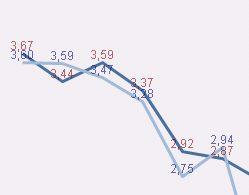
- « Previous Replies
-
- 1
- 2
- Next Replies »
- Mark as New
- Bookmark
- Subscribe
- Mute
- Subscribe to RSS Feed
- Permalink
- Report Inappropriate Content
There is no direct way to avoid an overlapping of values completely - just some workarounds. For example playing with various options to adjust the scaling or using several charts which are overlapping eachother. My favourite approach would be to use a dual-expressions and adding some line-breaks to move the values - I mean something like:
dual(num(sum(YourValues), '#.##0,00') & chr(10) & chr(10), sum(YourValues))
- Marcus
- Mark as New
- Bookmark
- Subscribe
- Mute
- Subscribe to RSS Feed
- Permalink
- Report Inappropriate Content
but where do you put this kind of expression?
- Mark as New
- Bookmark
- Subscribe
- Mute
- Subscribe to RSS Feed
- Permalink
- Report Inappropriate Content
Within the normal expression tab as replacement to your existing expression maybe in one expression or with a reversed logic of the line-breaks (not at the bottom else on top) in the other expressions, too.
This meant, I haven't mentioned it, that you need for each line a separate expression and for it quite probably a set analysis to differ which line displayed what.
I haven't tested it if this approach could be applied within a chart where a dimension defined the lines and only a single expression is used. If your chart is of this kind you could try if you could query the dimension within the dual too.
To make more clearly here a few further examples how it could be look like:
dual(YourExpression & chr(10) & chr(10), YourExpression) // simplified to the origin suggestion
dual(chr(10) & chr(10) & YourExpression, YourExpression) //reversed logig
dual(if(YourDimension = 'XYZ', chr(10) & chr(10), '') & YourExpression, YourExpression)
- Marcus
- Mark as New
- Bookmark
- Subscribe
- Mute
- Subscribe to RSS Feed
- Permalink
- Report Inappropriate Content
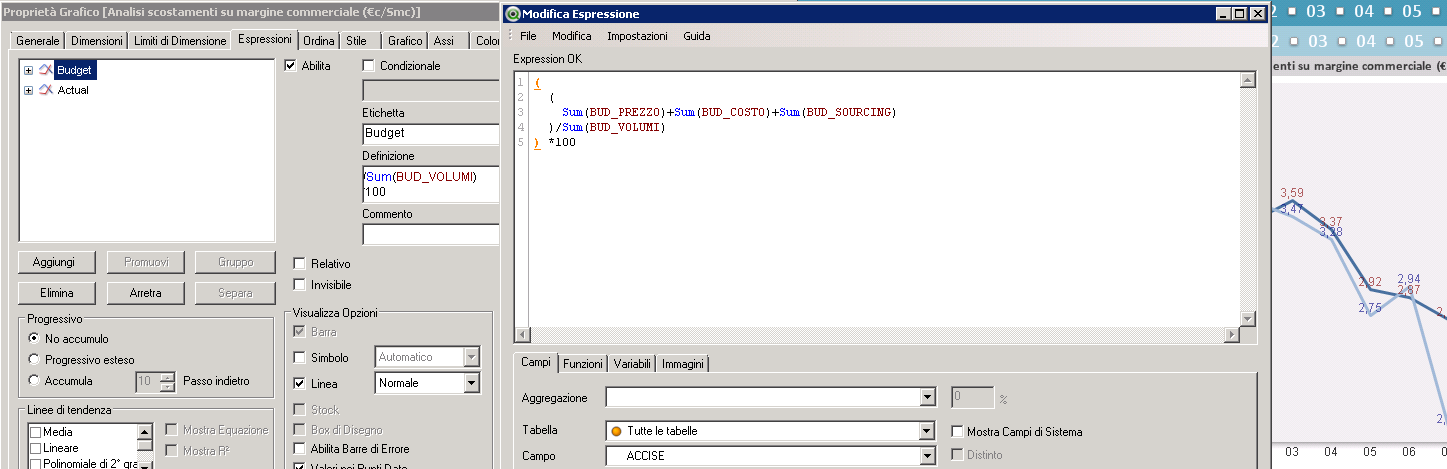
Sorry but i tried to did that but it not start, perhaps not understand look my picture... what i need to do in this expression i have?
the first expression is Budget, and the secong id Actual
- Mark as New
- Bookmark
- Subscribe
- Mute
- Subscribe to RSS Feed
- Permalink
- Report Inappropriate Content
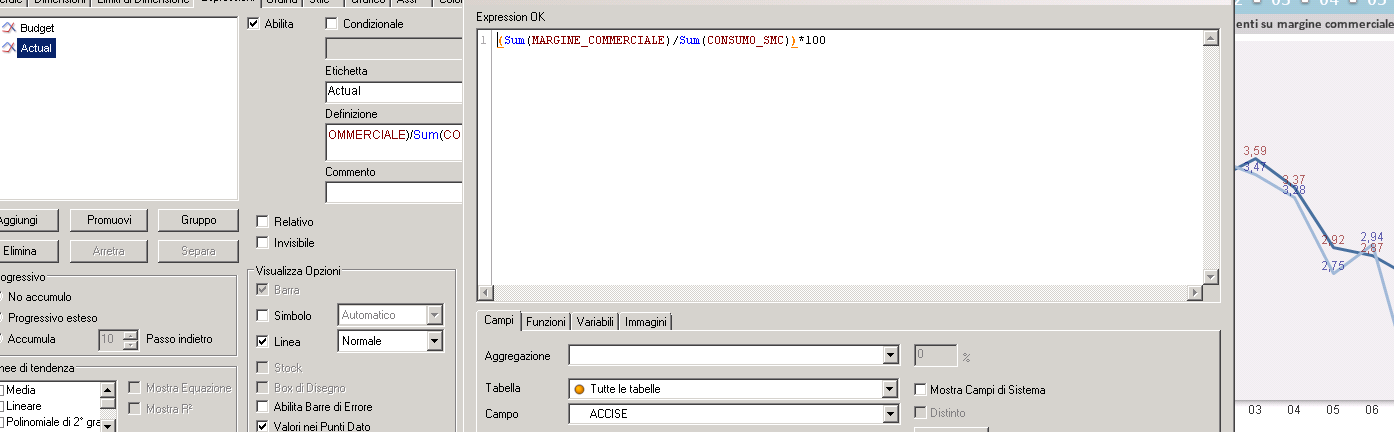
Do it with your budget-expression by replacing:
dual(YourExpression & chr(10) & chr(10), YourExpression)
the bold YourExpression with your used expression: ((sum(BUD.....) *100
- Marcus
- Mark as New
- Bookmark
- Subscribe
- Mute
- Subscribe to RSS Feed
- Permalink
- Report Inappropriate Content
Hi i did it but it not change nothing in my visualization
- Mark as New
- Bookmark
- Subscribe
- Mute
- Subscribe to RSS Feed
- Permalink
- Report Inappropriate Content
There is another important point for this. The formatting within the tab numbers must be on expression-standard then otherwise would be the formatting of the expressions ignored.
- Marcus
- Mark as New
- Bookmark
- Subscribe
- Mute
- Subscribe to RSS Feed
- Permalink
- Report Inappropriate Content
So what i need to do? i use this formatting you sent me in normal mode you sent me, and the formatting in tab numbers is normal, is: #.##0,00;(#.##0,00);-
- Mark as New
- Bookmark
- Subscribe
- Mute
- Subscribe to RSS Feed
- Permalink
- Report Inappropriate Content
Within the tab numbers mustn't be set any format for this expression.
- Marcus
- « Previous Replies
-
- 1
- 2
- Next Replies »