Unlock a world of possibilities! Login now and discover the exclusive benefits awaiting you.
- Qlik Community
- :
- All Forums
- :
- QlikView App Dev
- :
- Variable not working in a background color set anl...
- Subscribe to RSS Feed
- Mark Topic as New
- Mark Topic as Read
- Float this Topic for Current User
- Bookmark
- Subscribe
- Mute
- Printer Friendly Page
- Mark as New
- Bookmark
- Subscribe
- Mute
- Subscribe to RSS Feed
- Permalink
- Report Inappropriate Content
Variable not working in a background color set anlysis
Hello everyone,
I'm trying to display color on a bar chart. to be more specific, my bar chart is sorted by weeks and i'm trying to display color on the latest week (i'm using a master calendar which you can see here
QuartersMap:
MAPPING LOAD
rowno() as Month,
'Q' & Ceil (rowno()/3) as Quarter
AUTOGENERATE (12);
Temp:
Load
min(Created) as minDate,
max(Created) as maxDate
Resident MyTable1;
Let varMinDate = Num(Peek('minDate', 0, 'Temp'));
Let varMaxDate = Num(Peek('maxDate', 0, 'Temp'));
DROP Table Temp;
TempCalendar:
LOAD
$(varMinDate) + Iterno()-1 As Num,
Date($(varMinDate) + IterNo() - 1) as TempDate
AutoGenerate 1 While $(varMinDate) + IterNo() -1 <= $(varMaxDate);
MasterCalendar:
Load
TempDate as Created,
Year(TempDate) As Year,
WeekYear(TempDate) & '-' & Num(Week(weekstart(TempDate)),'00') as WeekYear,
Month(TempDate) As Month,
Day(TempDate) As Day,
YeartoDate(TempDate)*-1 as CurYTDFlag,
YeartoDate(TempDate,-1)*-1 as LastYTDFlag,
inyear(TempDate, Monthstart($(varMaxDate)),-1) as RC12,
date(monthstart(TempDate), 'MMM-YYYY') as MonthYear,
ApplyMap('QuartersMap', month(TempDate), Null()) as Quarter,
WeekDay(TempDate) as WeekDay
Resident TempCalendar
Order By TempDate ASC;
Drop Table TempCalendar;
).
But the thing is It cannot work properly
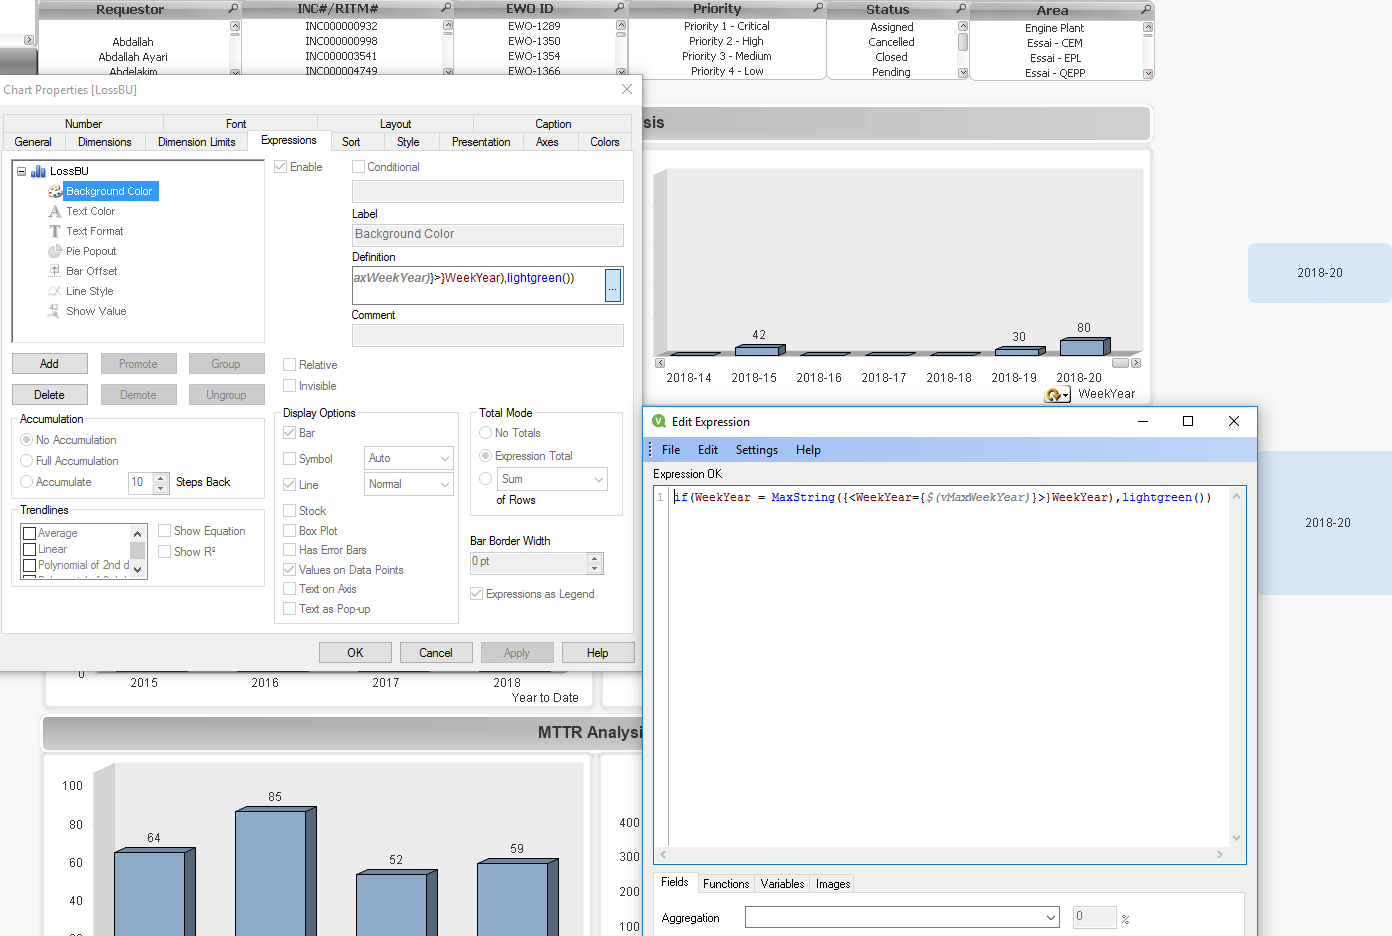
I put the formula in the set analysis background color. But the thing is it doesn't want to display the color
In a text box i put : =$(vMaxWeekYear) and the text box in blue display the data.
But if i put vMaxWeekYear it doesn't display anything
I don't know why

This what i put in the script.
Anyway thank you in advance
I attached the file in the description as
- Mark as New
- Bookmark
- Subscribe
- Mute
- Subscribe to RSS Feed
- Permalink
- Report Inappropriate Content
hello
create a variable in which you store the value of the max week (not the text of the function max())
and use this variable in the condition
the problem is present when there is a $() in the formula
- Mark as New
- Bookmark
- Subscribe
- Mute
- Subscribe to RSS Feed
- Permalink
- Report Inappropriate Content
Hi Yan,
I have fixed the color issue and attached is the your updated application.
Actually, put "=" before the function in variable "=" in the expression
Regards,
Akshaya
PS - if you find response as correct and helpful. Please mark it as Correct and Helpful
- Mark as New
- Bookmark
- Subscribe
- Mute
- Subscribe to RSS Feed
- Permalink
- Report Inappropriate Content
Than you it worked !!!
I have another uestion.
I have a cycle group in this chart (weekyear and monthyear). What kind of formula could i use for both of them (to display color for the current month and year)

- Mark as New
- Bookmark
- Subscribe
- Mute
- Subscribe to RSS Feed
- Permalink
- Report Inappropriate Content
As Akshaya suggested to use = in your variable. Just follow the same, like create another variable using Ctrl+Alt+V then add then give a variable name vMaxMonthYear then type in below expr
= Max(Date(Created, 'MMM-YYYY'))
So your variable will hold max month. Then in your chart expression background use below expr:
= if(WeekYear = MaxString({<WeekYear={'$(vMaxWeekYear)'}>}WeekYear) OR
MonthYear = '$(vMaxMonthYear)',lightgreen())
So you should see green for the bars with Max Week and MonthYear when you switch your cyclic dimensions.