Unlock a world of possibilities! Login now and discover the exclusive benefits awaiting you.
- Qlik Community
- :
- All Forums
- :
- QlikView App Dev
- :
- Re: Variables Computation
- Subscribe to RSS Feed
- Mark Topic as New
- Mark Topic as Read
- Float this Topic for Current User
- Bookmark
- Subscribe
- Mute
- Printer Friendly Page
- Mark as New
- Bookmark
- Subscribe
- Mute
- Subscribe to RSS Feed
- Permalink
- Report Inappropriate Content
Variables Computation
Dear all
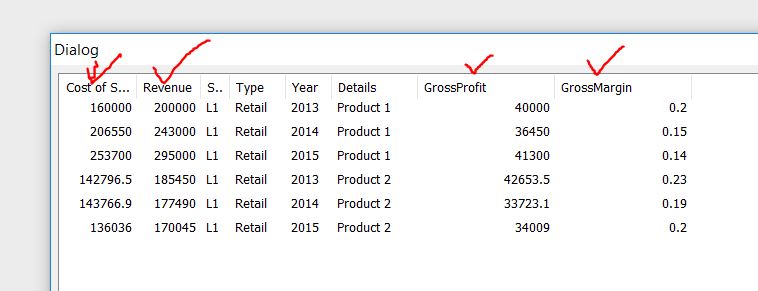
Kindly help to advise how to compute variables called Gross Profit and Gross Margin based on following raw data :
| Store | Account | Type | Details | 2013 | 2014 | 2015 |
| L1 | Revenue | Retail | Product 1 | 200,000 | 243,000 | 295,000 |
| L1 | Revenue | Retail | Product 2 | 185,450 | 177,490 | 170,045 |
| L1 | Cost of Sales | Retail | Product 1 | 160,000 | 206,550 | 253,700 |
| L1 | Cost of Sales | Retail | Product 2 | 142,797 | 143,767 | 136,036 |
Formula :
1. Gross Profit = Revenue - Cost of Sales
2. Gross Margin = Gross Profit / Revenue
Thank you
Tracy
- « Previous Replies
-
- 1
- 2
- Next Replies »
Accepted Solutions
- Mark as New
- Bookmark
- Subscribe
- Mute
- Subscribe to RSS Feed
- Permalink
- Report Inappropriate Content
Hi Tracy
You may use Pivot or Stright Table, something like this way.
Please find attached document.
- Mark as New
- Bookmark
- Subscribe
- Mute
- Subscribe to RSS Feed
- Permalink
- Report Inappropriate Content
Why don't you consider to put it in script ?
Like
Load
*,
(Revenue - Cost of Sales ) as [Gross Profit]
(Gross Profit / Revenue) as [Gross Margin]
Resident CrossTableName
- Mark as New
- Bookmark
- Subscribe
- Mute
- Subscribe to RSS Feed
- Permalink
- Report Inappropriate Content
Does this you need from Front End or Back End.
First you need cross table for Year as Data
And then You can use these formulas
Dim as you need
And Expressions, Something like this
1. Gross Profit = Sum({<Account ={'Revenue'}>}Data) - Sum({<Account = {'Cost of Sales'} >} Data)
2. Gross Margin = Column(1) / Sum({<Account ={'Revenue'}>}Data)
- Mark as New
- Bookmark
- Subscribe
- Mute
- Subscribe to RSS Feed
- Permalink
- Report Inappropriate Content
Dear Girirajsinh Vaghela
Thanks for your advice. I have tried but it does not work, please refer to attached QV fille.
Thank You
Tracy
- Mark as New
- Bookmark
- Subscribe
- Mute
- Subscribe to RSS Feed
- Permalink
- Report Inappropriate Content
Dear Anil Babu
Thanks for your advice.
Please refer to attached QV file and advise how to arrange Gross Profit and Gross Margin below the Cost of Sales ?.
Thank you
Tracy
- Mark as New
- Bookmark
- Subscribe
- Mute
- Subscribe to RSS Feed
- Permalink
- Report Inappropriate Content
PFA
I have tried to create them here in attached
- Mark as New
- Bookmark
- Subscribe
- Mute
- Subscribe to RSS Feed
- Permalink
- Report Inappropriate Content
I think a data model like this will be easier to work with
If you feel the same , i'll post the script!
If a post helps to resolve your issue, please accept it as a Solution.
- Mark as New
- Bookmark
- Subscribe
- Mute
- Subscribe to RSS Feed
- Permalink
- Report Inappropriate Content
Dear Vineeth Pujari
Thanks for your quick response. The answer is correct but which method did you use Script or Expression ?.
Thank You
Tracy
- Mark as New
- Bookmark
- Subscribe
- Mute
- Subscribe to RSS Feed
- Permalink
- Report Inappropriate Content
Check the attached App
If a post helps to resolve your issue, please accept it as a Solution.
- Mark as New
- Bookmark
- Subscribe
- Mute
- Subscribe to RSS Feed
- Permalink
- Report Inappropriate Content
Do you check if the attached working fine for you ?
- « Previous Replies
-
- 1
- 2
- Next Replies »