Unlock a world of possibilities! Login now and discover the exclusive benefits awaiting you.
- Qlik Community
- :
- All Forums
- :
- QlikView App Dev
- :
- Variables/if statement - summary view
- Subscribe to RSS Feed
- Mark Topic as New
- Mark Topic as Read
- Float this Topic for Current User
- Bookmark
- Subscribe
- Mute
- Printer Friendly Page
- Mark as New
- Bookmark
- Subscribe
- Mute
- Subscribe to RSS Feed
- Permalink
- Report Inappropriate Content
Variables/if statement - summary view
Hello,
I am brand new to Qlikview this week and have been working my way through tutorials/community threads for help. Unfortunately I cant find the answer to my current problem.
I have some underlying data like so:
Project number Impacted business dept Time Period Task Frequency Current task duration (mins)
PRJ0001 RATES Weekly 1 40
PRJ0002 RATES Weekly 2 20
PRJ0003 CREDIT Weekly 1 10
PRJ0004 CREDIT Monthly 15 120
PRJ0005 CREDIT Annually 4 100
In a straight chart I am able to add in a further column 'Yearly Hours', which has "$(YearlyHoursVar)" - which is a variable like so (which I defined through document properties)
Num(if([Time Period] = 'Daily',sum([Current task duration (mins)]*[Task Frequency]*5*52/60),
if([Time Period] = 'Hourly',sum([Current task duration (mins)]*[Task Frequency]*12*5*52/60),
if([Time Period] = 'Monthly',sum([Current task duration (mins)]*[Task Frequency]*12/60),
if([Time Period] = 'Annually',sum([Current task duration (mins)]*[Task Frequency]/60),
if([Time Period] = 'Weekly',sum([Current task duration (mins)]*[Task Frequency]*52/60)))))),'##.')
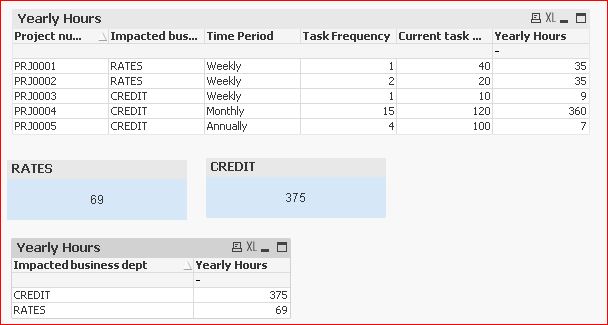
Project number Impacted business dept Time Period Task Frequency Current task duration (mins) Yearly Hours
PRJ0001 RATES Weekly 1 40 35
PRJ0002 RATES Weekly 2 20 35
PRJ0003 CREDIT Weekly 1 10 9
PRJ0004 CREDIT Monthly 15 120 360
PRJ0005 CREDIT Annually 4 100 7
Now this is perfect, just what a want.
But I also want to build a view of summary by impacted business department.
Expected result:
impacted bus. dept Yearly Hours
RATES 70
CREDIT 376
However, I build a straight table with Impacted business department as a dimension and and '$(YearlyHoursVar)' as the expression and it doesn't work. I know the reason why, I just cant figure out how to get round it.
The output would be:
RATES 70
CREDIT -
This is because rates just has 'weekly' time period, so i guess gets to 'weekly' in the if statement and then ends, whilst credit has 3 options to scroll through but exits the IF after the 'weekly' option so doesn't calculate the other two.
I need to iterate through all underlying project records and then add the the total.
Can someone please suggest a solution or equally let me know if I have gone the around this the wrong way?
Thanks,
Lizi
Accepted Solutions
- Mark as New
- Bookmark
- Subscribe
- Mute
- Subscribe to RSS Feed
- Permalink
- Report Inappropriate Content
- Mark as New
- Bookmark
- Subscribe
- Mute
- Subscribe to RSS Feed
- Permalink
- Report Inappropriate Content
Hi,
May be like this?
Edit:
Chart Inserted. You can move the expression to Variable.
- Mark as New
- Bookmark
- Subscribe
- Mute
- Subscribe to RSS Feed
- Permalink
- Report Inappropriate Content
Hi Settu,
When I try and open your file I get a message saying:
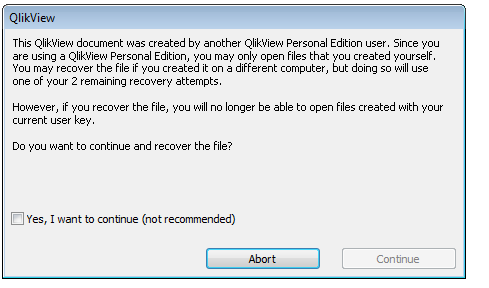
I don't really want to do this since I want to be able to open the files created with my current user key!!! Any way around this? or could you give me an overview of your solution?
- Mark as New
- Bookmark
- Subscribe
- Mute
- Subscribe to RSS Feed
- Permalink
- Report Inappropriate Content
oh and also - this needs to be in a chart (Straight table) as there are more than just 'credit' and 'rates' that I need to display! about 50 rows 
- Mark as New
- Bookmark
- Subscribe
- Mute
- Subscribe to RSS Feed
- Permalink
- Report Inappropriate Content
I'd calculate a multiplier in the script. And if possible also the Yearly hours. See attached example.
talk is cheap, supply exceeds demand
- Mark as New
- Bookmark
- Subscribe
- Mute
- Subscribe to RSS Feed
- Permalink
- Report Inappropriate Content
please ignore - i asked my org for the license and am now able to open your doc - checking it out!
- Mark as New
- Bookmark
- Subscribe
- Mute
- Subscribe to RSS Feed
- Permalink
- Report Inappropriate Content
Hi,
Bit Improved with variable..
- Mark as New
- Bookmark
- Subscribe
- Mute
- Subscribe to RSS Feed
- Permalink
- Report Inappropriate Content
Thank you for your help!
This worked a charm
- Mark as New
- Bookmark
- Subscribe
- Mute
- Subscribe to RSS Feed
- Permalink
- Report Inappropriate Content
Thank you for your help - I have marked settu's answer as the correct one as it is the solution I went for, but also played around with yours and worked too