Unlock a world of possibilities! Login now and discover the exclusive benefits awaiting you.
- Qlik Community
- :
- All Forums
- :
- QlikView App Dev
- :
- Re: Variance in a Bar Chart
Options
- Subscribe to RSS Feed
- Mark Topic as New
- Mark Topic as Read
- Float this Topic for Current User
- Bookmark
- Subscribe
- Mute
- Printer Friendly Page
Turn on suggestions
Auto-suggest helps you quickly narrow down your search results by suggesting possible matches as you type.
Showing results for
Not applicable
2013-03-12
04:03 PM
- Mark as New
- Bookmark
- Subscribe
- Mute
- Subscribe to RSS Feed
- Permalink
- Report Inappropriate Content
Variance in a Bar Chart
Hi,
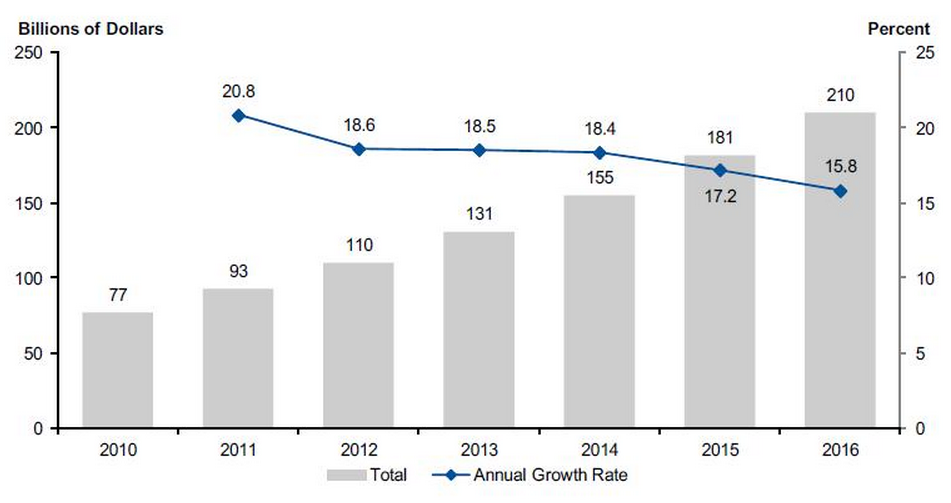
I'm trying to create a combo chart which shows the % annual growth of sales (like the blue line in the image).
The values on data points aren't that important, my question is how can I make this line.
I tryed use set analysis with current year - current year-1 but doesn't worked.
My idea is to use a Dimension Group with Year and Month to show the variance when the user interact with the chart.
2,140 Views
1 Solution
Accepted Solutions
Not applicable
2013-03-12
04:36 PM
Author
- Mark as New
- Bookmark
- Subscribe
- Mute
- Subscribe to RSS Feed
- Permalink
- Report Inappropriate Content
1,147 Views
2 Replies
Not applicable
2013-03-12
04:21 PM
Author
- Mark as New
- Bookmark
- Subscribe
- Mute
- Subscribe to RSS Feed
- Permalink
- Report Inappropriate Content
Hi,
Try with this:
(sum(Field) - Above(sum(Field))) / Above(Sum(Field))
Above() function gets the previous value.
Regards,
Ricardo
Not applicable
2013-03-12
04:36 PM
Author
- Mark as New
- Bookmark
- Subscribe
- Mute
- Subscribe to RSS Feed
- Permalink
- Report Inappropriate Content
Use:
=sum(Sales)/above(sum(Sales))-1
1,148 Views