Unlock a world of possibilities! Login now and discover the exclusive benefits awaiting you.
- Qlik Community
- :
- All Forums
- :
- QlikView App Dev
- :
- Version 10-11 Issue
- Subscribe to RSS Feed
- Mark Topic as New
- Mark Topic as Read
- Float this Topic for Current User
- Bookmark
- Subscribe
- Mute
- Printer Friendly Page
- Mark as New
- Bookmark
- Subscribe
- Mute
- Subscribe to RSS Feed
- Permalink
- Report Inappropriate Content
Version 10-11 Issue
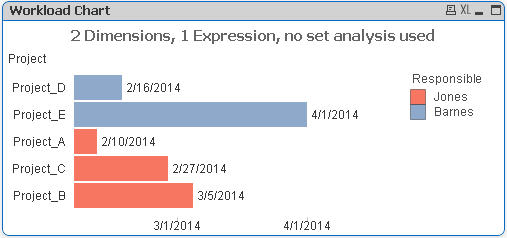
I have a simple bar chart with 2 dimensions and 1 expression. It plots perfectly in v11, but displays no bars at all in v10. I am forced to develop for v10 right now. Can anyone shed some light on what the issue is? The v11 chart looks like this:
But when I open the QVW in v10, the bars are gone and it looks like this:
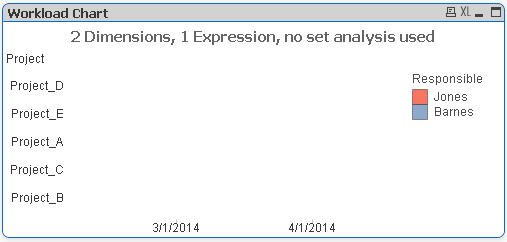
I started over in v10 and built the chart from scratch with the same result. I'm not using any v11-specific functionality that I know of. Since I have to deploy to v10 for the near future this is a show-stopper. My full versions are 10.00.9061.7 SR3 64-bit and 11.20.11643.0 IR 64-bit. Thanks in advance for the help,
Rich
Accepted Solutions
- Mark as New
- Bookmark
- Subscribe
- Mute
- Subscribe to RSS Feed
- Permalink
- Report Inappropriate Content
I see what you mean. Out of desperation/curiosity, I checked "Log Scale" instead and the chart plotted perfectly. No idea why, but I will accept this as a duct-tape solution until we can someday upgrade to v11. Thanks for pointing me in the right direction.
R
- Mark as New
- Bookmark
- Subscribe
- Mute
- Subscribe to RSS Feed
- Permalink
- Report Inappropriate Content
The problem lies with the Forced 0 setting of the expression axis. No idea why though. Possibly a bug.
edit: seems to have to do with the second dimension. It's possible to remove it and use a workaround. See attached qvw.
talk is cheap, supply exceeds demand
- Mark as New
- Bookmark
- Subscribe
- Mute
- Subscribe to RSS Feed
- Permalink
- Report Inappropriate Content
I see what you mean. Out of desperation/curiosity, I checked "Log Scale" instead and the chart plotted perfectly. No idea why, but I will accept this as a duct-tape solution until we can someday upgrade to v11. Thanks for pointing me in the right direction.
R
- Mark as New
- Bookmark
- Subscribe
- Mute
- Subscribe to RSS Feed
- Permalink
- Report Inappropriate Content
Works for me in QV 10. I have 10.00.9731.9 SR6 64-bit.
- Mark as New
- Bookmark
- Subscribe
- Mute
- Subscribe to RSS Feed
- Permalink
- Report Inappropriate Content
Hi,
Always try to have installed the latest build no matter which version of QlikView you have (10, 11 or 11.20). In case of QV 10, I think latest build is 10.00 9731 SR6.
Regards