Unlock a world of possibilities! Login now and discover the exclusive benefits awaiting you.
- Qlik Community
- :
- All Forums
- :
- QlikView
- :
- Vertical Reference Lines in Normal Distribution Pl...
- Subscribe to RSS Feed
- Mark Topic as New
- Mark Topic as Read
- Float this Topic for Current User
- Bookmark
- Subscribe
- Mute
- Printer Friendly Page
- Mark as New
- Bookmark
- Subscribe
- Mute
- Subscribe to RSS Feed
- Permalink
- Report Inappropriate Content
Vertical Reference Lines in Normal Distribution Plot
Dear Community,
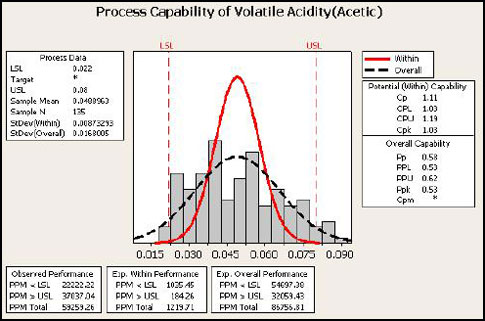
I need to plot a Normal Distribution Curve(Bell Curve). In that I need to display LSL and USL (Specification Limits) values vertically. Please have a look at the below Image and please help me how can I achieve this.
Thanks in advance
Regards
Manideep
- Tags:
- normal_distribution
- qlikview_layout_visualizations
- reference_lines
- vertical_line
- visualization_problem
Accepted Solutions
- Mark as New
- Bookmark
- Subscribe
- Mute
- Subscribe to RSS Feed
- Permalink
- Report Inappropriate Content
Hi All, I could find answer myself. Please go through the below post. so that it will be helpful for you also.
- Mark as New
- Bookmark
- Subscribe
- Mute
- Subscribe to RSS Feed
- Permalink
- Report Inappropriate Content
Hi All, I could find answer myself. Please go through the below post. so that it will be helpful for you also.
- Mark as New
- Bookmark
- Subscribe
- Mute
- Subscribe to RSS Feed
- Permalink
- Report Inappropriate Content
Hi Manideep
I too need to plot reference lines in my graph but i need to show the labels on either side of the graph. How did you manage to put the labels on the top of the reference line and I need to show the labels on both right and left of the same reference line..Any suggestions?