Unlock a world of possibilities! Login now and discover the exclusive benefits awaiting you.
QlikView App Dev
Discussion Board for collaboration related to QlikView App Development.
Announcements
Introducing Qlik Answers: A plug-and-play, Generative AI powered RAG solution.
READ ALL ABOUT IT!
- Qlik Community
- :
- All Forums
- :
- QlikView App Dev
- :
- Who Me Too'd this topic
Who Me Too'd this topic
Partner - Specialist
2014-02-25
06:54 AM
- Mark as New
- Bookmark
- Subscribe
- Mute
- Subscribe to RSS Feed
- Permalink
- Report Inappropriate Content
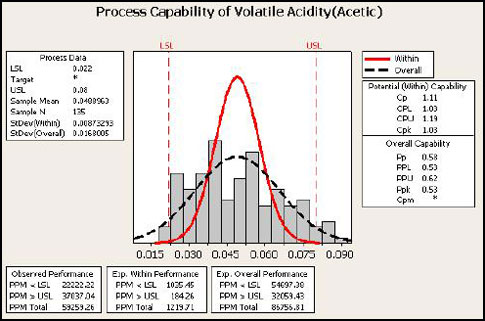
Vertical Reference Lines in Normal Distribution Plot
Dear Community,
I need to plot a Normal Distribution Curve(Bell Curve). In that I need to display LSL and USL (Specification Limits) values vertically. Please have a look at the below Image and please help me how can I achieve this.
Thanks in advance

Regards
Manideep
954 Views