Unlock a world of possibilities! Login now and discover the exclusive benefits awaiting you.
- Qlik Community
- :
- All Forums
- :
- QlikView App Dev
- :
- Visual Cues in Pivot with different limits
- Subscribe to RSS Feed
- Mark Topic as New
- Mark Topic as Read
- Float this Topic for Current User
- Bookmark
- Subscribe
- Mute
- Printer Friendly Page
- Mark as New
- Bookmark
- Subscribe
- Mute
- Subscribe to RSS Feed
- Permalink
- Report Inappropriate Content
Visual Cues in Pivot with different limits
Hi1
I have a pivot table vithe 6 dimention values and 8 different expressions. See attached file
I have also loaded a list of target values. It's differet targets for each dimentions.
E.g.For one expression, Store A has a target of 99,55, store B 99,38 etc.
What i want to is to set the coulur to Red of an expression/dimention if the value is below the target value.
How can I do this?
- Mark as New
- Bookmark
- Subscribe
- Mute
- Subscribe to RSS Feed
- Permalink
- Report Inappropriate Content
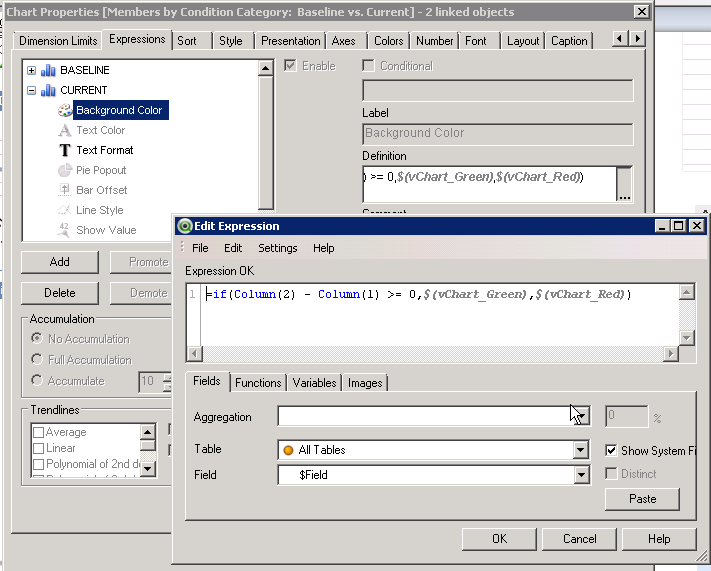
Add an expression in the advanced formatting section for the respective Expression(s)...something like this:

- Mark as New
- Bookmark
- Subscribe
- Mute
- Subscribe to RSS Feed
- Permalink
- Report Inappropriate Content
As Jim suggested use the background expressions based on your Target values for each expression field.
Attached is the sample based on your excel. Changed the Field value for Field A lesser than target to get the red background. Check and let us know. Add the remaining target values as mentioned in the app.