Unlock a world of possibilities! Login now and discover the exclusive benefits awaiting you.
- Qlik Community
- :
- All Forums
- :
- QlikView App Dev
- :
- Want to Show Sub Total in QlikView Report
- Subscribe to RSS Feed
- Mark Topic as New
- Mark Topic as Read
- Float this Topic for Current User
- Bookmark
- Subscribe
- Mute
- Printer Friendly Page
- Mark as New
- Bookmark
- Subscribe
- Mute
- Subscribe to RSS Feed
- Permalink
- Report Inappropriate Content
Want to Show Sub Total in QlikView Report
Hello Experts,
I just want to show subtotal in my QlikView report ie.
That is my Orignal Data:
Year | Month | Quarter | Name | Sales |
| 2001 | January | Q1 | Tata | 1000 |
| 2001 | February | Q1 | Tata | 1000 |
| 2001 | March | Q1 | Tata | 2000 |
| 2001 | April | Q2 | Tata | 2000 |
| 2001 | May | Q2 | Tata | 1000 |
| 2001 | June | Q2 | Tata | 1000 |
| 2001 | July | Q3 | Tata | 1000 |
| 2001 | August | Q3 | Tata | 1000 |
| 2001 | September | Q3 | Tata | 2000 |
| 2001 | October | Q4 | Tata | 2000 |
| 2001 | November | Q4 | Tata | 2000 |
| 2001 | December | Q4 | Tata | 4000 |
| 2001 | January | Q1 | Barclay | 100000 |
| 2001 | February | Q1 | Barclay | 50000 |
| 2001 | March | Q1 | Barclay | 50000 |
| 2001 | April | Q2 | Barclay | 200000 |
| 2001 | May | Q2 | Barclay | 100000 |
| 2001 | June | Q2 | Barclay | 100000 |
| 2001 | July | Q3 | Barclay | 50000 |
| 2001 | August | Q3 | Barclay | 50000 |
| 2001 | September | Q3 | Barclay | 100000 |
| 2001 | October | Q4 | Barclay | 50000 |
| 2001 | November | Q4 | Barclay | 100000 |
| 2001 | December | Q4 | Barclay | 50000 |
| 2001 | January | Q1 | Reliance | 25000 |
| 2001 | February | Q1 | Reliance | 10000 |
| 2001 | March | Q1 | Reliance | 15000 |
| 2001 | April | Q2 | Reliance | 50000 |
| 2001 | May | Q2 | Reliance | 50000 |
| 2001 | June | Q2 | Reliance | 50000 |
| 2001 | July | Q3 | Reliance | 50000 |
| 2001 | August | Q3 | Reliance | 50000 |
| 2001 | September | Q3 | Reliance | 50000 |
| 2001 | October | Q4 | Reliance | 50000 |
| 2001 | November | Q4 | Reliance | 50000 |
| 2001 | December | Q4 | Reliance | 50000 |
| 2002 | January | Q1 | Tata | 15000 |
| 2002 | February | Q1 | Tata | 15000 |
| 2002 | March | Q1 | Tata | 15000 |
| 2002 | April | Q2 | Tata | 25000 |
| 2002 | May | Q2 | Tata | 25000 |
| 2002 | June | Q2 | Tata | 25000 |
| 2002 | July | Q3 | Tata | 20000 |
| 2002 | August | Q3 | Tata | 20000 |
| 2002 | September | Q3 | Tata | 30000 |
| 2002 | October | Q4 | Tata | 40000 |
| 2002 | November | Q4 | Tata | 15000 |
| 2002 | December | Q4 | Tata | 15000 |
| 2002 | January | Q1 | Barclay | 400000 |
| 2002 | February | Q1 | Barclay | 100000 |
| 2002 | March | Q1 | Barclay | 100000 |
| 2002 | April | Q2 | Barclay | 150000 |
| 2002 | May | Q2 | Barclay | 70000 |
| 2002 | June | Q2 | Barclay | 80000 |
| 2002 | July | Q3 | Barclay | 100000 |
| 2002 | August | Q3 | Barclay | 25000 |
| 2002 | September | Q3 | Barclay | 25000 |
| 2002 | October | Q4 | Barclay | 50000 |
| 2002 | November | Q4 | Barclay | 50000 |
| 2002 | December | Q4 | Barclay | 50000 |
| 2002 | January | Q1 | Reliance | 3000 |
| 2002 | February | Q1 | Reliance | 3000 |
| 2002 | March | Q1 | Reliance | 4000 |
| 2002 | April | Q2 | Reliance | 20000 |
| 2002 | May | Q2 | Reliance | 10000 |
| 2002 | June | Q2 | Reliance | 10000 |
| 2002 | July | Q3 | Reliance | 10000 |
| 2002 | August | Q3 | Reliance | 10000 |
| 2002 | September | Q3 | Reliance | 5000 |
| 2002 | October | Q4 | Reliance | 5000 |
| 2002 | November | Q4 | Reliance | 10000 |
| 2002 | December | Q4 | Reliance | 10000 |
I wat to show my record in group Like -
Name- Tata
coloumn1 column2 column3
-------------------------------------------------------------------
Subtotal-
-------------------------------------------------------------------
Name - Barclay
coloumn1 column2 column3
-------------------------------------------------------------------
Subtotal-
-------------------------------------------------------------------
Name- Reliance
coloumn1 column2 column3
-------------------------------------------------------------------
Subtotal-
-------------------------------------------------------------------
-------------------------------------------------------------------
Grand Total-
-------------------------------------------------------------------
How can i do this one,Please help me.
Right now i have created one table object where i have taked columns and then i am coping my object i report but i am unable to generate Group subtotal.
Thanks in Advance.
- « Previous Replies
-
- 1
- 2
- Next Replies »
- Mark as New
- Bookmark
- Subscribe
- Mute
- Subscribe to RSS Feed
- Permalink
- Report Inappropriate Content
Hi,
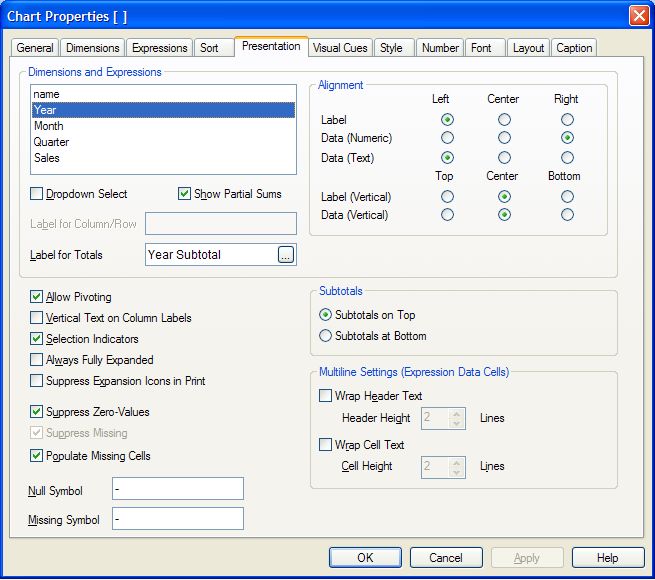
Thanks, When you go to Presentation tab there you see Dimension and Expression, there when you select Year below the optons you see the Label for Totals tex box type Subtotal there
See the snapshots.
Regards
Anand
- Mark as New
- Bookmark
- Subscribe
- Mute
- Subscribe to RSS Feed
- Permalink
- Report Inappropriate Content
Hi Sunil,
Thankyou very much for your reply.
It is also woring but not showing right sum.May be i am wrong with concept.
Can you tell me 'Show partial Sum' will wahat tell ti us.
Is it like if i will check this option for Name that means it will show partially sum grouping by name.
If i am wrong please correct me.
Thanks.
Seeking for your reply.
- Mark as New
- Bookmark
- Subscribe
- Mute
- Subscribe to RSS Feed
- Permalink
- Report Inappropriate Content
Hi Anand,
You are right it is working for changing name of the label.
but i am a bit confused. because i am checked 'Show Partial Sum' option for my four dimentions and now it is showing one-one subtotal for each row. Instead of this i want this Subtotal grouped by name or other dimetions.
I thing i am worng with some things.
I want Sum on Quaterly Basis and i checked that option for all.
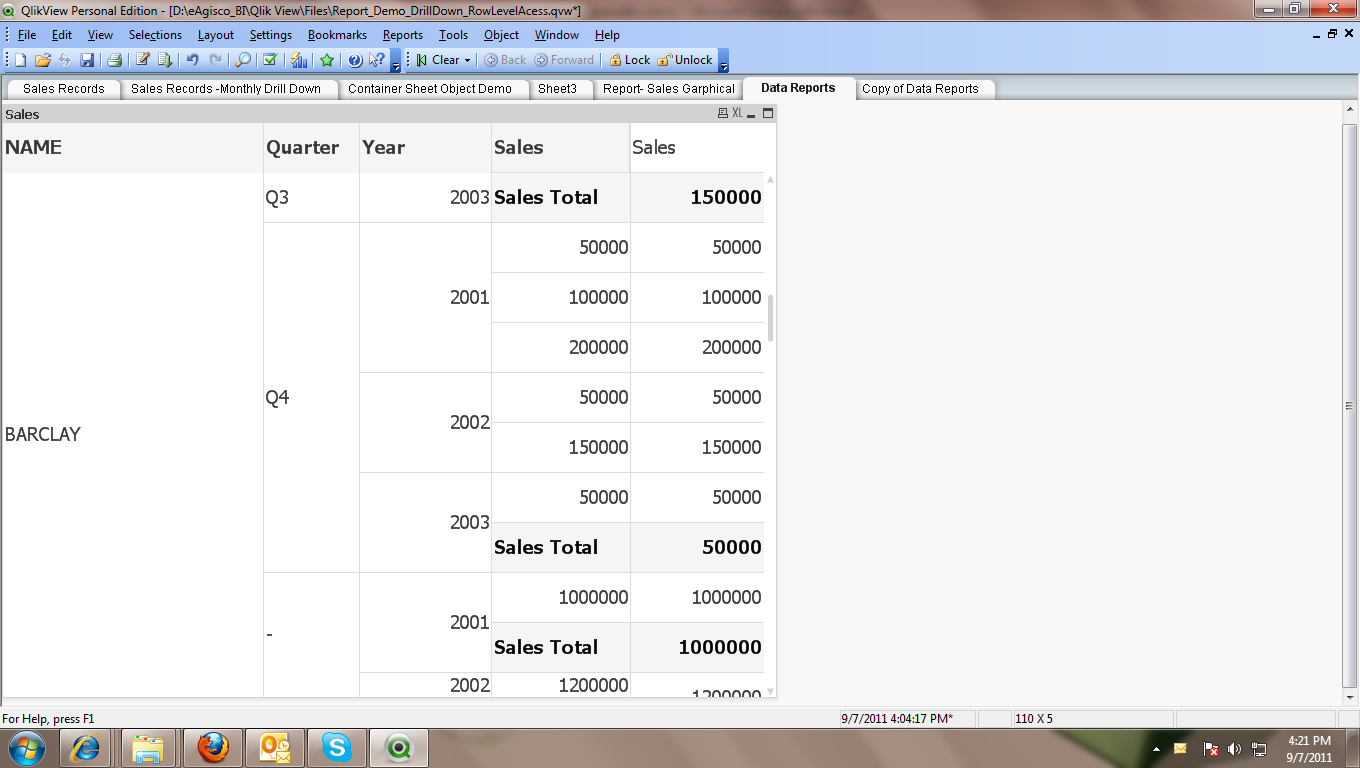
Please see image and if my logic and expectation is diffrent please tell me.
Thanks you very much for your meaningful reply.
- Mark as New
- Bookmark
- Subscribe
- Mute
- Subscribe to RSS Feed
- Permalink
- Report Inappropriate Content
Hi Gaurav,
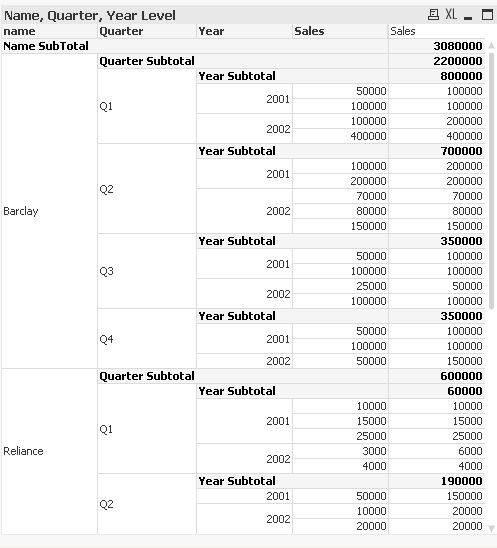
If you want to select the name level Subtotal value then you need to select -> Show Partial Sum -> And give the label its easy on which level you want you just need to select.
See my attached sample there is two chart one show all by Name, Quarter, Year and second one is only for Name.
Regards,
Anand
- Mark as New
- Bookmark
- Subscribe
- Mute
- Subscribe to RSS Feed
- Permalink
- Report Inappropriate Content
Hi Anand,
Actually i can't access qvw file because i have demo version of QlikView.
but i am trying to make right grouping.
Tell me another thing how can i put name on group header.
Like i want to print name only once in group header.
ie.
Name- Barclay
column1 column2 column3
data data data
----------------------------------------------------
SubTotal-
---------------------------------------------------
Name-Tata
data data data
----------------------------------------------------
SubTotal-
---------------------------------------------------
----------------------------------------------------
Grand Total-
---------------------------------------------------
Please help me if you know and if posible, please sent me sanpshots.
Thanks,
Gaurav Saxena
- Mark as New
- Bookmark
- Subscribe
- Mute
- Subscribe to RSS Feed
- Permalink
- Report Inappropriate Content
Hi,
In pivot you are able to show data some thing like this i below snapshot.
Regards,
Anand
- « Previous Replies
-
- 1
- 2
- Next Replies »