Unlock a world of possibilities! Login now and discover the exclusive benefits awaiting you.
- Qlik Community
- :
- All Forums
- :
- QlikView App Dev
- :
- Re: Waterfall Chart - How to display values on top...
- Subscribe to RSS Feed
- Mark Topic as New
- Mark Topic as Read
- Float this Topic for Current User
- Bookmark
- Subscribe
- Mute
- Printer Friendly Page
- Mark as New
- Bookmark
- Subscribe
- Mute
- Subscribe to RSS Feed
- Permalink
- Report Inappropriate Content
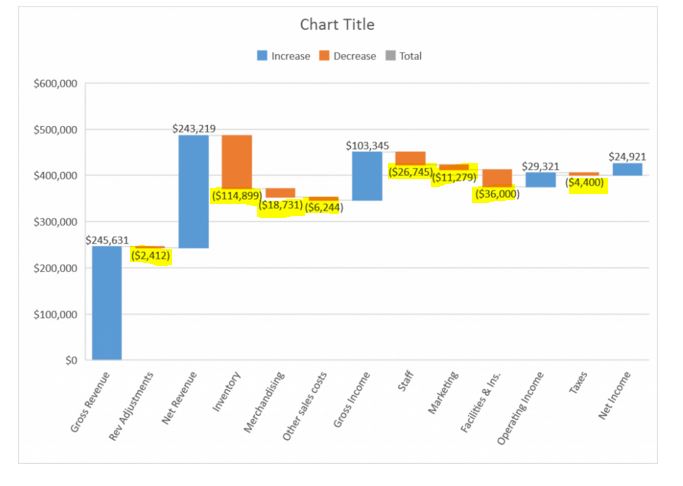
Waterfall Chart - How to display values on top of the segments
Hi all,
I am working on a waterfall chart and have a question on how to display the values on top of the bars/segments always even when the value drops?
For all the highlighted values below how do we get them to display on top of the bar??
Screenshot below:
- Mark as New
- Bookmark
- Subscribe
- Mute
- Subscribe to RSS Feed
- Permalink
- Report Inappropriate Content
Hi,
in my practice, I usually present Waterfall charts using positive amounts and manage their direction (up or down) by calculating the offset accordingly. This way, all bars carry positive numbers, and the numbers are always presented on top of the bars.
You can also try experimenting with Dual() values - your numeric value can be positive, while text representation may look like negative.
Finally, you can experiment with an extra set of Expressions - those with no visual Representation, except for "Values on Data Points".
Learn these and many other advanced development techniques from my new book QlikView Your Business.
Cheers,
Oleg Troyansky
- Mark as New
- Bookmark
- Subscribe
- Mute
- Subscribe to RSS Feed
- Permalink
- Report Inappropriate Content
You probably need to check if your value is negative, then multiply by -1 to get a positive number.
Positive numbers are shown on the top, negative on the bottom of a bar chart.
You may need to adjust the bar offset to take care of the changed sign as well as creating a dual value with a text representation that shows your negative original value as text.
- Mark as New
- Bookmark
- Subscribe
- Mute
- Subscribe to RSS Feed
- Permalink
- Report Inappropriate Content
I am using native Qliksense Waterfall chart Nov release . I have formatting issue for subtotals when i use formatting as Measure Expression .
When i format to number i get negative values while i subtract to get subtotal.
I Multiplied by -1 and used subtract it screws up subtotal. Any other ways on how to show subtotal total number (currently is shows 1.5k ) it should represent a number like 1489 ..
Thanks for your help ,
Venkata Gogineni