Unlock a world of possibilities! Login now and discover the exclusive benefits awaiting you.
- Qlik Community
- :
- All Forums
- :
- QlikView App Dev
- :
- 'Webbed' Hierarchy DataModel Problem
- Subscribe to RSS Feed
- Mark Topic as New
- Mark Topic as Read
- Float this Topic for Current User
- Bookmark
- Subscribe
- Mute
- Printer Friendly Page
- Mark as New
- Bookmark
- Subscribe
- Mute
- Subscribe to RSS Feed
- Permalink
- Report Inappropriate Content
'Webbed' Hierarchy DataModel Problem
I am trying to solve a data design problem that has been plaguing me. I would appreciate any suggestions on how to solve this. The data is system mapping information. Source1.field1 feeds Source2.Field1 feeds Source3.Field8. I want to be able to report on the fields/sources and find out what correlated fields are up and downstream from it. I have tried various Hierarchy models but can't quite figure out a solid way to model this data without getting circular tables. See the below links for samples I have attempted but haven't managed to implement with my specific solution:
Select parent to inclusive select all children
Implementing a child-parent hierarchical datamodel using double relationships
A sample database would be two tables: The first being a mapping of field to field and comments on that mapping. The second being individual fields and comments on those fields.
| FromSource | FromField | ToSource | ToField | FromKey | ToKey | MapComment1 | MapComment2 | MapComment3 |
| BRS | duration | IDB | EffDur | BRS~duration | IDB~EffDur | Uncertain | ||
| BRS | mat_yield | IDB | yield | BRS~mat_yield | IDB~yield | Certain | ||
| BRS | fund_id | IDB | Portf_no | BRS~fund_id | IDB~Portf_no | Unknown | ||
| BRS | fund | IDB | portf_name | BRS~fund | IDB~portf_name | Unknown | ||
| BRS | duration | GDH | effective duration | BRS~duration | GDH~effective duration | Unknown | ||
| BRS | mat_yield | GDH | yield to mat | BRS~mat_yield | GDH~yield to mat | Unknown | ||
| BRS | ord_num | GDH | order id | BRS~ord_num | GDH~order id | Certain | ||
| BRS | ord_no | GDH | order number | BRS~ord_no | GDH~order number | Certain | ||
| BRS | fund_id | GDH | portf_no | BRS~fund_id | GDH~portf_no | Certain | ||
| BRS | fund | GDH | portfolio name | BRS~fund | GDH~portfolio name | Certain | ||
| GDH | effective duration | IDB | EffDur | GDH~effective duration | IDB~EffDur | Uncertain | ||
| GDH | yield to mat | IDB | yield | GDH~yield to mat | IDB~yield | Uncertain | ||
| GDH | portfolio name | IDB | portf_name | GDH~portfolio name | IDB~portf_name | Uncertain | ||
| GDH | portf_no | IDB | Portf_no | GDH~portf_no | IDB~Portf_no |
| Source | FieldID | Key | FieldComment1 | FieldComment2 | FieldComment3 |
| IDB | EffDur | IDB~EffDur | P1D1 Reqd | ||
| IDB | portf_name | IDB~portf_name | P1D1 Reqd | ||
| IDB | Portf_no | IDB~Portf_no | P1D1 Reqd | ||
| IDB | yield | IDB~yield | P1D1 Reqd | ||
| GDH | effective duration | GDH~effective duration | P1D2 Reqd | ||
| GDH | yield to mat | GDH~yield to mat | P1D2 Reqd | ||
| GDH | order id | GDH~order id | P1D2 Reqd | ||
| GDH | order number | GDH~order number | P1D2 Reqd | ||
| GDH | portfolio name | GDH~portfolio name | P1D2 Reqd | ||
| GDH | portf_no | GDH~portf_no | P1D2 Reqd | ||
| BRS | duration | BRS~duration | P1D1 Reqd | ||
| BRS | mat_yield | BRS~mat_yield | P1D1 Reqd | ||
| BRS | ord_num | BRS~ord_num | P1D2 Reqd | ||
| BRS | ord_no | BRS~ord_no | P1D2 Reqd | ||
| BRS | fund_id | BRS~fund_id | P1D1 Reqd | ||
| BRS | fund | BRS~fund | P1D1 Reqd |
- Mark as New
- Bookmark
- Subscribe
- Mute
- Subscribe to RSS Feed
- Permalink
- Report Inappropriate Content
Do you have a sample of how you want to visualize this ? Like a expandable node hierarchy ? Could use a sample end point .
- Mark as New
- Bookmark
- Subscribe
- Mute
- Subscribe to RSS Feed
- Permalink
- Report Inappropriate Content
I want to be able to select a field and know what fields source or feed data to/from it. There are different use cases where i select a field and want a record for each mapping/path that includes that field, displaying comments about the individual fields and comments on the individual mappings. A path could have 5 fields: 1:2 would have comments, 2:3 would have comments, 3:4 would have comments, 4:5 would have comments. There could also be indirect mapping comments, so there could be a mapping record of 1:4 with comments on that mapping as well.
I'm not sure i'm being particularly descriptive and I recognize it's a morass that should be better defined to help figure out the data model.
- Mark as New
- Bookmark
- Subscribe
- Mute
- Subscribe to RSS Feed
- Permalink
- Report Inappropriate Content
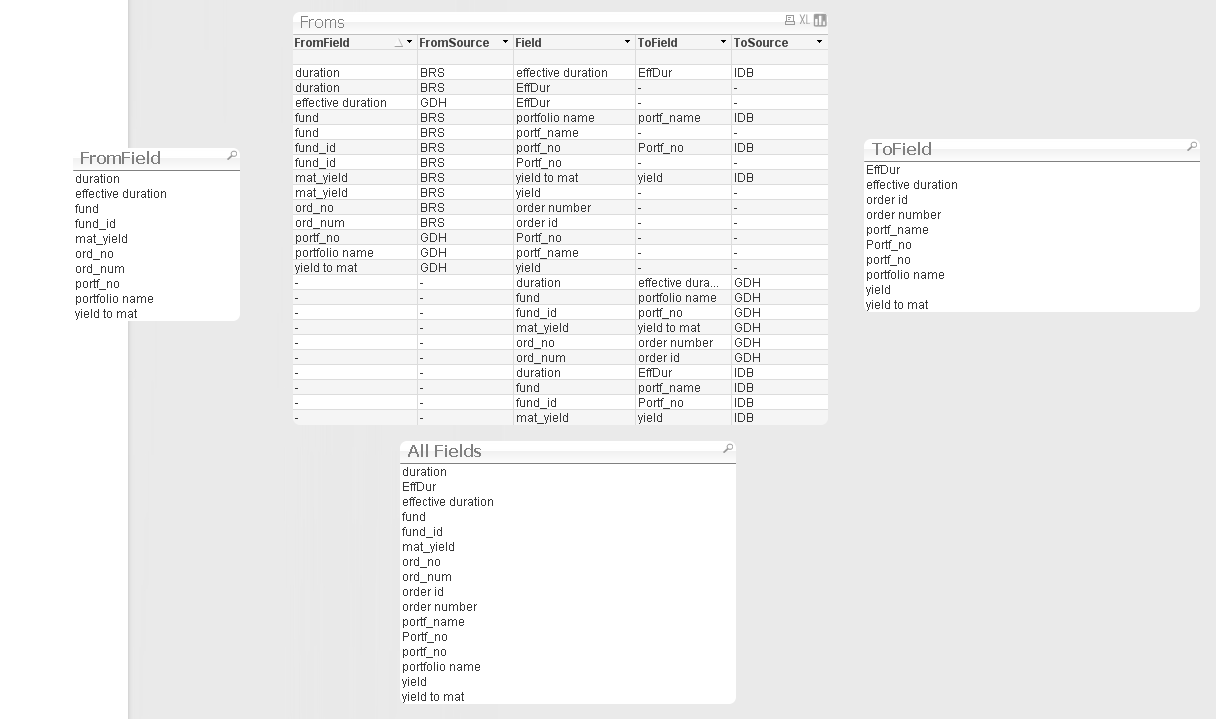
Ok its a little unclear so consider this just a way of getting your creative instincts going.
I tried to put in a flow : From -> To.
The main table shows Field in the middle and on the left you see all the fields that feed it, and on the right you see all the fields it feeds
Perhaps a better visual may be this Slope Graph Extension here:
SlopeGraph for QlikView (D3SlopeGraph QlikView Extension)
