Unlock a world of possibilities! Login now and discover the exclusive benefits awaiting you.
- Qlik Community
- :
- All Forums
- :
- QlikView App Dev
- :
- Re: Week format in graph
- Subscribe to RSS Feed
- Mark Topic as New
- Mark Topic as Read
- Float this Topic for Current User
- Bookmark
- Subscribe
- Mute
- Printer Friendly Page
- Mark as New
- Bookmark
- Subscribe
- Mute
- Subscribe to RSS Feed
- Permalink
- Report Inappropriate Content
Week format in graph
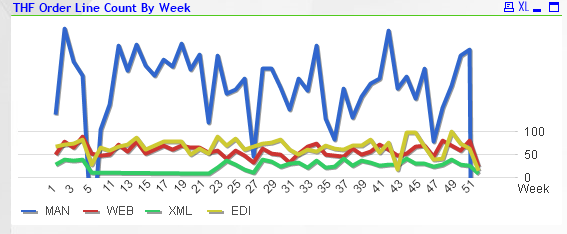
I have a graph that is displaying data current date minus a year. I have the graph set up in week intervals. Right now the first weeks of 2018 are displaying in the beinging of the graph not the end like i would like. Is it possible to change this so it goes in order. so it would go Week 51,52,1,2
Current Graph :
Accepted Solutions
- Mark as New
- Bookmark
- Subscribe
- Mute
- Subscribe to RSS Feed
- Permalink
- Report Inappropriate Content
Hi,
just change to sorting.
go to the sorting tab on the properties of the graph and uncheck everything, and check "numeric value" descending
- Mark as New
- Bookmark
- Subscribe
- Mute
- Subscribe to RSS Feed
- Permalink
- Report Inappropriate Content
hello
on your dimension date, make a dual with week name and week number in format YYYYWW and sort your axis on that value
- Mark as New
- Bookmark
- Subscribe
- Mute
- Subscribe to RSS Feed
- Permalink
- Report Inappropriate Content
Hi,
just change to sorting.
go to the sorting tab on the properties of the graph and uncheck everything, and check "numeric value" descending