Unlock a world of possibilities! Login now and discover the exclusive benefits awaiting you.
- Qlik Community
- :
- All Forums
- :
- QlikView App Dev
- :
- Re: Week's Min & Max Date as Dimension?
- Subscribe to RSS Feed
- Mark Topic as New
- Mark Topic as Read
- Float this Topic for Current User
- Bookmark
- Subscribe
- Mute
- Printer Friendly Page
- Mark as New
- Bookmark
- Subscribe
- Mute
- Subscribe to RSS Feed
- Permalink
- Report Inappropriate Content
Week's Min & Max Date as Dimension?
I am trying to display the start and end dates of a week as a dimension in a line chart. I have a Date field and a Week field, but can't figure out how to put the two together so that one dimension would show a value for things completed between 10/20/2013 - 10/26/2013, for example. The attached image shows what I am trying to do. Any help would be appreciated.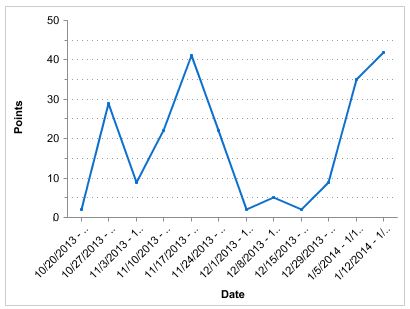
Accepted Solutions
- Mark as New
- Bookmark
- Subscribe
- Mute
- Subscribe to RSS Feed
- Permalink
- Report Inappropriate Content
Use a calculated dimension: =weekstart(MyDate) & '-' & weekend(MyDate). Or create a field using that expression in the script and use the new field as dimension.
talk is cheap, supply exceeds demand
- Mark as New
- Bookmark
- Subscribe
- Mute
- Subscribe to RSS Feed
- Permalink
- Report Inappropriate Content
Another option is to use the class function. See the attached for an example.
- Mark as New
- Bookmark
- Subscribe
- Mute
- Subscribe to RSS Feed
- Permalink
- Report Inappropriate Content
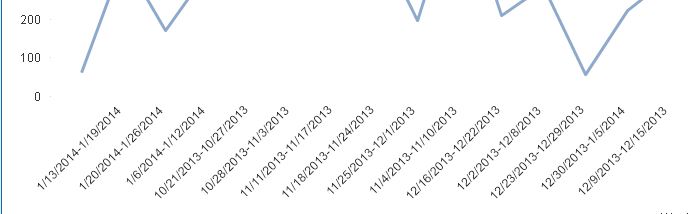
Gysbert Wassenaar, that's it! The only issue I have now is sorting, especially now in the new year since we have dates from early months this year and late months last year. I've tried using all of the Sort by defaults but they don't get it right, I'm guessing some type of expression will need to be used?
- Mark as New
- Bookmark
- Subscribe
- Mute
- Subscribe to RSS Feed
- Permalink
- Report Inappropriate Content
Class function is a possibility. Another is to order your "week strings" according to an expression, like:
=Avg(MyDate)
ascending. Should work here.
- Mark as New
- Bookmark
- Subscribe
- Mute
- Subscribe to RSS Feed
- Permalink
- Report Inappropriate Content
To fix sorting use weekstart(MyDate) as Sorting Expression