Unlock a world of possibilities! Login now and discover the exclusive benefits awaiting you.
- Qlik Community
- :
- All Forums
- :
- QlikView App Dev
- :
- Re: Weighted Average in time spread...
- Subscribe to RSS Feed
- Mark Topic as New
- Mark Topic as Read
- Float this Topic for Current User
- Bookmark
- Subscribe
- Mute
- Printer Friendly Page
- Mark as New
- Bookmark
- Subscribe
- Mute
- Subscribe to RSS Feed
- Permalink
- Report Inappropriate Content
Weighted Average in time spread...
Dear users,
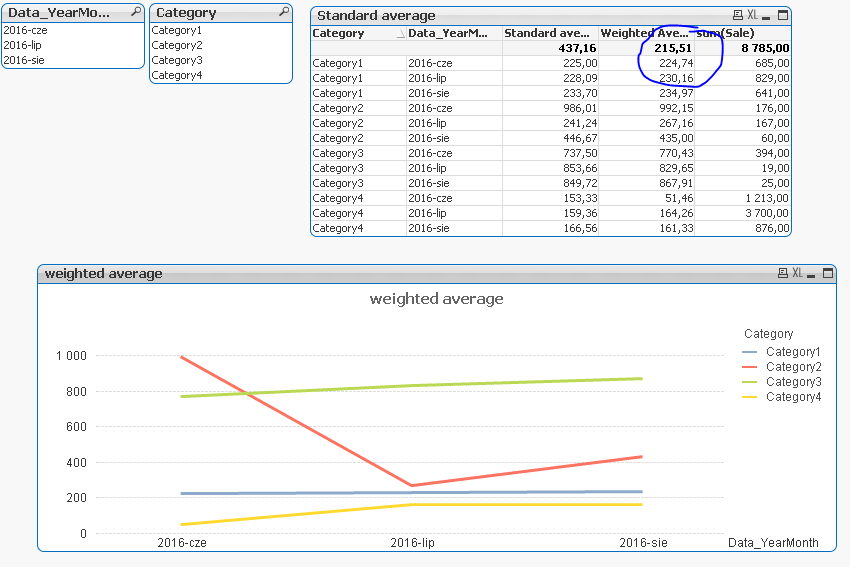
I want to show weighted average on a Line Chart. Dimensions are: YearMonth and Category.
Below example regarding one project, there will be many YearMonth records, but Category will be still 1, 2, 3...
At the moment, my weighted average metric is like below, but it calculates me total by number of months. Is it possible to show me aggregated weighted average for each YearMont dimension? This will allow to show me weighted averages on linear chart, so there will be possibility to track weighted average changes in time.
Thank you in advance.
//Weighted average metric:
sum (
    aggr(
        (sum(volume) / sum(total volume))*
          sum(nettprice), category, YearMonth)    )
| YearMonth | Category | NettPrice | Weighted Avg | Volume | Desired goal of showing weithted avg on line chart |
| Category1 | 216 | 1 263,34 | |||
| 2016-06 | Category1 | 216,00 | 30,86 | 180,48 | 216,00 |
| 2016-07 | Category1 | 216,00 | 30,86 | 180,48 | 216,00 |
| 2016-08 | Category1 | 216,00 | 30,86 | 180,48 | 216,00 |
| 2016-09 | Category1 | 216,00 | 30,86 | 180,48 | 216,00 |
| 2016-10 | Category1 | 216,00 | 30,86 | 180,48 | 216,00 |
| 2016-11 | Category1 | 216,00 | 30,86 | 180,48 | 216,00 |
| 2016-12 | Category1 | 216,00 | 30,86 | 180,48 | 216,00 |
| Category2 | 115,2 | 134,55 | |||
| 2016-06 | Category2 | 115,20 | 16,46 | 19,22 | 115,20 |
| 2016-07 | Category2 | 115,20 | 16,46 | 19,22 | 115,20 |
| 2016-08 | Category2 | 115,20 | 16,46 | 19,22 | 115,20 |
| 2016-09 | Category2 | 115,20 | 16,46 | 19,22 | 115,20 |
| 2016-10 | Category2 | 115,20 | 16,46 | 19,22 | 115,20 |
| 2016-11 | Category2 | 115,20 | 16,46 | 19,22 | 115,20 |
| 2016-12 | Category2 | 115,20 | 16,46 | 19,22 | 115,20 |
- Tags:
- weighted average
- « Previous Replies
-
- 1
- 2
- Next Replies »
- Mark as New
- Bookmark
- Subscribe
- Mute
- Subscribe to RSS Feed
- Permalink
- Report Inappropriate Content
Try this:
Sum(Sale * NetPrice)/Sum(Sale)
- Mark as New
- Bookmark
- Subscribe
- Mute
- Subscribe to RSS Feed
- Permalink
- Report Inappropriate Content
Hello Sunny,
thank you, but in the meantime I used expression but with PriceVolume calculation in the script.
In fact, whole process is far more complicated in my application than in my example, but it worked.
Result is the same, so we may close this topic. Thank you. 
Best,
K.
- « Previous Replies
-
- 1
- 2
- Next Replies »