Unlock a world of possibilities! Login now and discover the exclusive benefits awaiting you.
- Qlik Community
- :
- All Forums
- :
- QlikView App Dev
- :
- Re: Weighted Average with Text Values
- Subscribe to RSS Feed
- Mark Topic as New
- Mark Topic as Read
- Float this Topic for Current User
- Bookmark
- Subscribe
- Mute
- Printer Friendly Page
- Mark as New
- Bookmark
- Subscribe
- Mute
- Subscribe to RSS Feed
- Permalink
- Report Inappropriate Content
Weighted Average with Text Values
I have a form where submissions include two questions with 5 important levels and 5 options in each, and I want to see the weighted average of each option within each question
Question 1: What is most important to you?
Options: Support, Documentation, Quality, Patience, Speed
Most Important | Important | Neutral | Not Important | Least Important
Question 2: What is most important to you?
Options: Communication, Professionalism, Activity, Completion, Punctuality
Importance Most Important | Important | Neutral | Not Important | Least Important
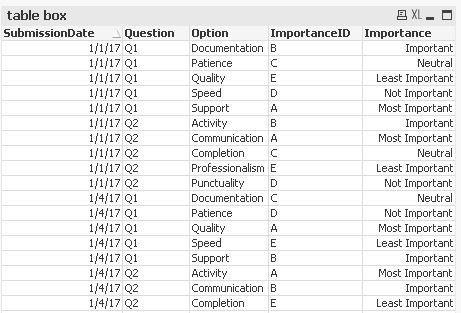
Results table
| SubmissionDate | Question1A | Question1B | Question1C | Queston1D | Queston1E | Question2A | Question2B | Question2C | Queston2D | Question2E |
|---|---|---|---|---|---|---|---|---|---|---|
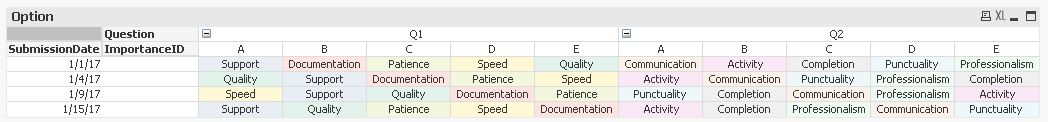
| 1/1/17 | Support | Documentation | Patience | Speed | Quality | Communication | Activity | Completion | Punctuality | Professionalism |
| 1/4/17 | Quality | Support | Documentation | Patience | Speed | Activity | Communication | Punctuality | Professionalism | Completion |
| 1/9/17 | Speed | Support | Quality | Documentation | Patience | Punctuality | Completion | Communication | Professionalism | Activity |
| 1/15/17 | Support | Quality | Patience | Speed | Documentation | Activity | Completion | Professionalism | Communication | Punctuality |
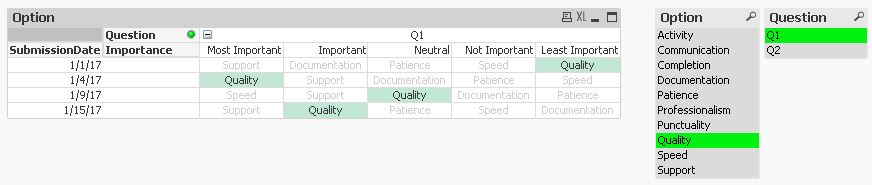
At the end of the day, I am trying to create a table that changes it's order based on the weighted average score.
| Support | Documentation | Quality | Patience | Speed |
|---|---|---|---|---|
| 3.8 | 3.2 | 2.3 | 2.1 | 1.8 |
I created an inline load for the two option sets:
Dim1:
LOAD * INLINE [
Dim1
Speed
Documentation
Patience
Support
Quality
];
Dim2:
LOAD * INLINE [
Dim2
Communication
Activity
Completion
Punctuality
Professionalism
];
In the table, the dimension is set as 'Dim1' and there are two expressions.
1. Unknown
2. RowNo()
Best expression I could come up with was something like this which didn't work.
If(Dim1='Speed',sum(if(Question1A='Speed',5,
if(Question1B='Speed',4,
if(Question1C='Speed',3,
if(Question1D='Speed'=2,
if(Question1E='Speed',1,0)))))
Thank you for the help,
Phil
- Mark as New
- Bookmark
- Subscribe
- Mute
- Subscribe to RSS Feed
- Permalink
- Report Inappropriate Content
First of all, thank you for your assistance.
As I mentioned before, and I am likely reading it wrong, but doesn't this apply a 1-5 weight to the Dim values?
When I think of the intended outcome, we want to count the number of times each Dim value is submitted in Question1A and give each of those a score of 5. Then down the line for Question1B=4, 1C=3, 1D=2, 1E=1. Each Dim value would get a total score given the weighting of Question1A-E and the frequency.
Where in your example does Question1A represent 5 points?
- Mark as New
- Bookmark
- Subscribe
- Mute
- Subscribe to RSS Feed
- Permalink
- Report Inappropriate Content
can you post a snapshot of what exactly do you want to measure of see?
a table in excel maybe
If a post helps to resolve your issue, please accept it as a Solution.
- Mark as New
- Bookmark
- Subscribe
- Mute
- Subscribe to RSS Feed
- Permalink
- Report Inappropriate Content
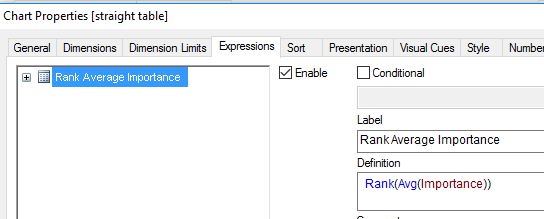
We plan to run these reports based on a state value through NPrinting for the final report. The QVW I attached includes the objects we're using in NPrinting, but I can't get the ranking to work. The idea is that for each state (cycle dimension in NPrinting) we will be able to see a weighted average of how important each one of those Dim values were. One state may say that on average Speed and Patience are more important than the others.
I just realized I had typos in my original request that don't line up to the QVW I attached. The final table should be ranked 1 through 5 in order of most to least importance, rather than the average decimal score.
- Mark as New
- Bookmark
- Subscribe
- Mute
- Subscribe to RSS Feed
- Permalink
- Report Inappropriate Content
Sorry, but this is not helping me visualize what you need
If a post helps to resolve your issue, please accept it as a Solution.
- Mark as New
- Bookmark
- Subscribe
- Mute
- Subscribe to RSS Feed
- Permalink
- Report Inappropriate Content
Vineeth,
We are trying to run NPrinting reports that has two separate tables for the two weighted average displays. With the five options in each question, we want to see how important each option is ranked. When we get a submission, the user is telling us how they rank the five options from Most Important to Least Important.
For the reports, we use the State field to cycle the results of each printout. Say we have 5 responses for Kansas:
| SubmissionDate | Question1A | Question1B | Question1C | Queston1D | Queston1E |
|---|---|---|---|---|---|
| 1/1/17 | Support | Documentation | Patience | Speed | Quality |
| 1/4/17 | Quality | Support | Documentation | Patience | Speed |
| 1/9/17 | Patience | Support | Quality | Documentation | Speed |
| 1/15/17 | Support | Quality | Patience | Speed | Documentation |
| 1/19/17 | Support | Quality | Documentation | Patience | Speed |
Support: Most Important - 3, Important - 2, Neutral - 0, Not Important - 0, Least Important - 0
Support Total:23 / 5 = 4.6 --> Ranked 1
Quality: Most Important - 1, Important - 2, Neutral - 1, Not Important - 0, Least Important - 1
Quality Total:17 / 5 = 3.4 --> Ranked 2
Documentation: Most Important - 0, Important - 1, Neutral - 2, Not Important - 1, Least Important - 1
Documentation Total: 13 / 5 = 2.4 --> Ranked 3
Patience: Most Important - 1, Important - 0, Neutral - 2, Not Important - 2, Least Important - 0
Patience Total:13 / 5 = 2.4 --> Ranked 4
Speed: Most Important - 0, Important - 0, Neutral - 0, Not Important - 2, Least Important - 3
Speed Total:7 / 5 = 2.2 --> Ranked 5
Kansas Report Output:
| Support | Quality | Documentation | Patience | Speed |
|---|---|---|---|---|
| 1 | 2 | 3 | 4 | 5 |
Let me know if you need anything else clarified. Thank you!
- Mark as New
- Bookmark
- Subscribe
- Mute
- Subscribe to RSS Feed
- Permalink
- Report Inappropriate Content
how did we derive 23 here?
Support Total:23 / 5
If a post helps to resolve your issue, please accept it as a Solution.
- Mark as New
- Bookmark
- Subscribe
- Mute
- Subscribe to RSS Feed
- Permalink
- Report Inappropriate Content
Support:
Most Important - 3 responses = 15 points
Important - 2 responses = 8 points
Neutral - 0 responses = 0 points
Not Important - 0 responses = 0 points
Least Important - 0 responses = 0 points
15+8 = 23
Support Total:23 / 5 = 4.6 --> Ranked 1
Most Important answers are worth 5 points, Important are worth 4, and so on.
Thank you!
- Mark as New
- Bookmark
- Subscribe
- Mute
- Subscribe to RSS Feed
- Permalink
- Report Inappropriate Content
Any thoughts? I have been really stuck trying to figure it out.
Thank you for the help
- Mark as New
- Bookmark
- Subscribe
- Mute
- Subscribe to RSS Feed
- Permalink
- Report Inappropriate Content
Hi,
I have attached a small sample application, have a look at it and hope it helps your scenario!
- Mark as New
- Bookmark
- Subscribe
- Mute
- Subscribe to RSS Feed
- Permalink
- Report Inappropriate Content
Hi,
one possible solution might be:


mapImportance:
Mapping
LOAD Chr(70-RecNo()), Dual(Imp,RecNo()) INLINE [
Imp
Least Important
Not Important
Neutral
Important
Most Important
];
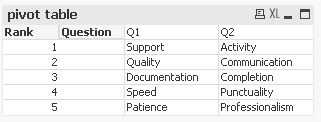
tabQuestions:
CrossTable (QuestTemp,Option)
LOAD * FROM [https://community.qlik.com/thread/250055] (html, codepage is 1252, embedded labels, table is @1);
Join
LOAD Distinct
QuestTemp,
'Q'&Mid(QuestTemp,Len(QuestTemp)-1,1) as Question,
Right(QuestTemp,1) as ImportanceID,
ApplyMap('mapImportance',Right(QuestTemp,1)) as Importance
Resident tabQuestions;
DROP Field QuestTemp;
hope this helps
regards
Marco