Unlock a world of possibilities! Login now and discover the exclusive benefits awaiting you.
- Qlik Community
- :
- All Forums
- :
- QlikView App Dev
- :
- What is 80-20 formula and pareto rule in qlikview?...
- Subscribe to RSS Feed
- Mark Topic as New
- Mark Topic as Read
- Float this Topic for Current User
- Bookmark
- Subscribe
- Mute
- Printer Friendly Page
- Mark as New
- Bookmark
- Subscribe
- Mute
- Subscribe to RSS Feed
- Permalink
- Report Inappropriate Content
What is 80-20 formula and pareto rule in qlikview?? ...please help me on this
Hi,
Can anybody explain me the 80-20 rule and parreto rule...in simple method with example and how can we use it in charts...please let me know
thanks
- Mark as New
- Bookmark
- Subscribe
- Mute
- Subscribe to RSS Feed
- Permalink
- Report Inappropriate Content
Hi,
pleasego through the attachment
a simple pareto analysis and steps to develope
Thanks
Sasi
- Mark as New
- Bookmark
- Subscribe
- Mute
- Subscribe to RSS Feed
- Permalink
- Report Inappropriate Content
Hi ,
This technique helps to identify the top portion of causes that need to be addressed to resolve the majority of problems. Once the predominant causes are identified, then tools like theIshikawa diagram or Fish-bone Analysis can be used to identify the root causes of the problems. While it is common to refer to pareto as "80/20" rule, under the assumption that, in all situations, 20% of causes determine 80% of problems, this ratio is merely a convenient rule of thumb and is not nor should it be considered immutable law of nature.
The application of the Pareto analysis in risk management allows management to focus on those risks that have the most impact on the project
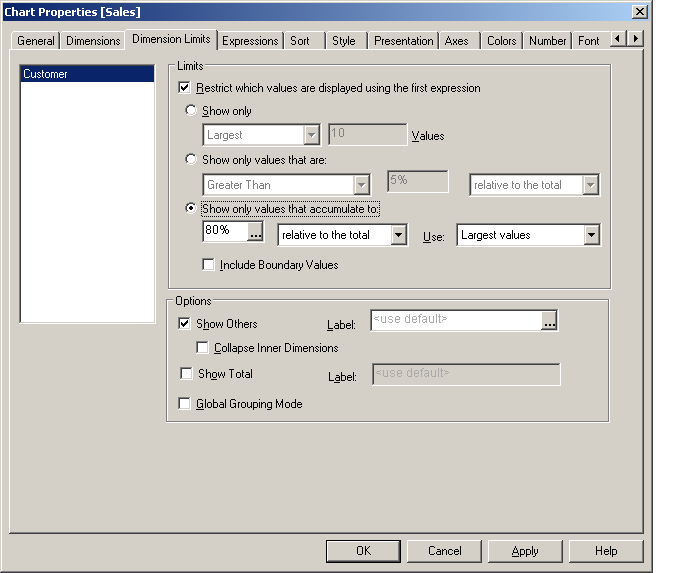
you can use it in dimension limit in qlikview for example if you want to show the countries population which are 80% of the world population.
- Mark as New
- Bookmark
- Subscribe
- Mute
- Subscribe to RSS Feed
- Permalink
- Report Inappropriate Content
Hi,
Please find below document written by Henric.
http://community.qlik.com/blogs/qlikviewdesignblog/2013/12/09/pareto-analysis
Regards
Please appreciate our Qlik community members by giving Kudos for sharing their time for your query. If your query is answered, please mark the topic as resolved 🙂
- Mark as New
- Bookmark
- Subscribe
- Mute
- Subscribe to RSS Feed
- Permalink
- Report Inappropriate Content
Hi Sasi,
i cud not get any of the attachment here.pls let me know abt that.
Thanks,
Vasudha Mishra
- Mark as New
- Bookmark
- Subscribe
- Mute
- Subscribe to RSS Feed
- Permalink
- Report Inappropriate Content
sry
PFA