Unlock a world of possibilities! Login now and discover the exclusive benefits awaiting you.
- Qlik Community
- :
- All Forums
- :
- QlikView App Dev
- :
- Re: Where not equal to in Table chart
- Subscribe to RSS Feed
- Mark Topic as New
- Mark Topic as Read
- Float this Topic for Current User
- Bookmark
- Subscribe
- Mute
- Printer Friendly Page
- Mark as New
- Bookmark
- Subscribe
- Mute
- Subscribe to RSS Feed
- Permalink
- Report Inappropriate Content
Where not equal to in Table chart
Hello All,
I have a table with data as below
Product
AA
BB
CF
HG
Market
HG
IJ
KL
How do i select products where Product is NOT EQUAL to Market. My final result should be
Product
AA
BB
CF
HG
HG
IJ
KL
- Tags:
- chart table
- Mark as New
- Bookmark
- Subscribe
- Mute
- Subscribe to RSS Feed
- Permalink
- Report Inappropriate Content
Did u try with...
Sum(Revenue) / Sum(TOTAL Revenue)..
Multiply with 100 which gives you percentage or Check the Show in percentage option in the number tab.
- Mark as New
- Bookmark
- Subscribe
- Mute
- Subscribe to RSS Feed
- Permalink
- Report Inappropriate Content
Hi,
Sunny Answer is correct.
if u have the issue still,could u pls share ur app once with us .
- Mark as New
- Bookmark
- Subscribe
- Mute
- Subscribe to RSS Feed
- Permalink
- Report Inappropriate Content
Hello
Thanks for the suggestions and hope every one had a nice weekend!!
I will try to explain my whole problem here.
Sales Person , Market, Product i have as Dimensions in my Table
And the formulas are as follows:
Sales Current Year = Sum(Sales) where Year=Current Year
Sales Last Year : Sum(Sales) where Year=(Current Year)-1
Difference : 2017-2016
Difference in %: (2017-2016)/2016
MarketShare : ?
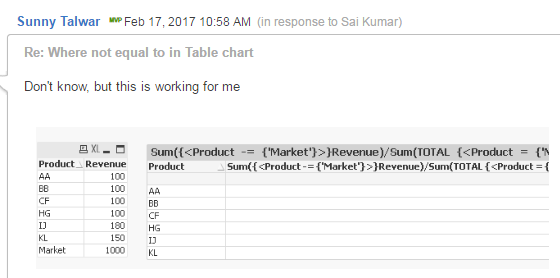
(Sum({<Produkt -= {'Market'}>}Sales)/
Sum({<Produkt = {'Market'}>}Sales))
MarketShare in % : ?
(The % for above formula)
The first 4 formulas work fine but the formulas for Market share don't produce any results. I also tried setting the Product Dimension as Product=if(Product<>'Market',Produkt)
- Mark as New
- Bookmark
- Subscribe
- Mute
- Subscribe to RSS Feed
- Permalink
- Report Inappropriate Content
May be fault the Field Name
Instead of Produkt used Product
(Sum({<Product -= {'Market'}>}Sales)/Sum({<Product = {'Market'}>}Sales))
- Mark as New
- Bookmark
- Subscribe
- Mute
- Subscribe to RSS Feed
- Permalink
- Report Inappropriate Content
It is a Typo mistake here, but in my Qlikview script i have it as Product.
- Mark as New
- Bookmark
- Subscribe
- Mute
- Subscribe to RSS Feed
- Permalink
- Report Inappropriate Content
Are you trying this in QlikView Script. Script won't support Set Analysis
but in my Qlikview script i have it as Product.
- Mark as New
- Bookmark
- Subscribe
- Mute
- Subscribe to RSS Feed
- Permalink
- Report Inappropriate Content
I mean in my Set Analysis only.
Sorry for not being clear
- Mark as New
- Bookmark
- Subscribe
- Mute
- Subscribe to RSS Feed
- Permalink
- Report Inappropriate Content
Have you look Sunny's Reply. Same thing he used why it is not working for you? And can you elaborate more with your Original data and expected result?
- Mark as New
- Bookmark
- Subscribe
- Mute
- Subscribe to RSS Feed
- Permalink
- Report Inappropriate Content
Hello All,
Attaching my original data in an CSV file and also the expected result stated below.
Area Market Product Date Sales(1+2+3) Units(1+2+3)
In the data where the Product column is Empty it has to be considered as Whole Market results
Ex: for Market D4 we have Product column as'Empty ' or 'CA'. Here i would like to see CA/Empty for each Area, Market, Product and Date .
- Mark as New
- Bookmark
- Subscribe
- Mute
- Subscribe to RSS Feed
- Permalink
- Report Inappropriate Content
Hello All,
Has any one been able to look at the data and find something?