Unlock a world of possibilities! Login now and discover the exclusive benefits awaiting you.
- Qlik Community
- :
- All Forums
- :
- QlikView App Dev
- :
- Re: Which chart item suits best as I used Bar char...
- Subscribe to RSS Feed
- Mark Topic as New
- Mark Topic as Read
- Float this Topic for Current User
- Bookmark
- Subscribe
- Mute
- Printer Friendly Page
- Mark as New
- Bookmark
- Subscribe
- Mute
- Subscribe to RSS Feed
- Permalink
- Report Inappropriate Content
Which chart item suits best as I used Bar chart but the layout is not proper?
Hi,
Dimension 1: Member_sheetA
Dimension 2: Test
Expression: =Num(Count({<Result={'Fail'}>} Distinct Reference_SheetA)) / Num(Count(Distinct Reference_SheetA))
can anyone suggest me which chart item suits best as I used Bar chart but the layout is not proper and tried with other charts. I jsu got confusion to use which chart.
Thanks.
- Tags:
- new_to_qlikview
- Mark as New
- Bookmark
- Subscribe
- Mute
- Subscribe to RSS Feed
- Permalink
- Report Inappropriate Content
Please see attached.
- Mark as New
- Bookmark
- Subscribe
- Mute
- Subscribe to RSS Feed
- Permalink
- Report Inappropriate Content
Hi,
You Have to use Straight table or Pivot table otherwise make some changes in the bar scale by right click on chart -> Axes -> Scale -> then set here Static Min, Static Max and Static Sep then it will be better.
Thanks & Regards
- Mark as New
- Bookmark
- Subscribe
- Mute
- Subscribe to RSS Feed
- Permalink
- Report Inappropriate Content
Thanks. Can you suggest the figures if possible to give in Static Min , Static Max and Static Step.
I used but it seems not showing correct in bars.
- Mark as New
- Bookmark
- Subscribe
- Mute
- Subscribe to RSS Feed
- Permalink
- Report Inappropriate Content
- Mark as New
- Bookmark
- Subscribe
- Mute
- Subscribe to RSS Feed
- Permalink
- Report Inappropriate Content
Hi,
In your check which is the minimum value and maximum value change according to that and make separate value otherwise best option is pivot table.
Thanks & Regards
- Mark as New
- Bookmark
- Subscribe
- Mute
- Subscribe to RSS Feed
- Permalink
- Report Inappropriate Content
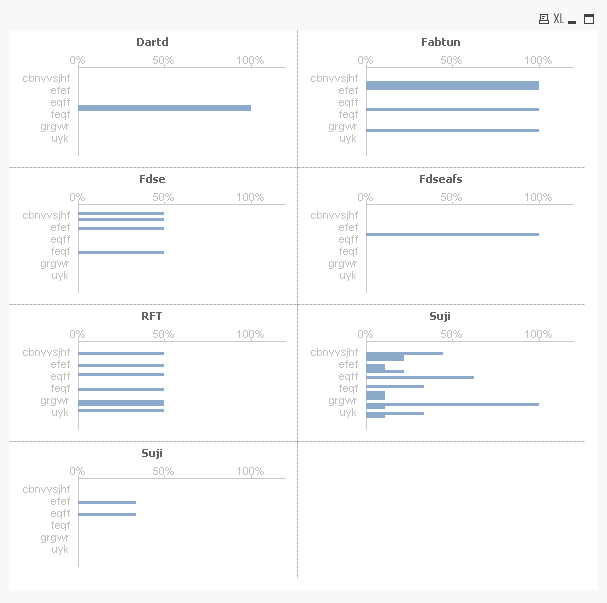
can I know how you split like this?
EDIT: I suppose it is trellis right?
- Mark as New
- Bookmark
- Subscribe
- Mute
- Subscribe to RSS Feed
- Permalink
- Report Inappropriate Content
Thanks. I already have pivot table. so now looking to use graph chart.
- Mark as New
- Bookmark
- Subscribe
- Mute
- Subscribe to RSS Feed
- Permalink
- Report Inappropriate Content
Hi,
Try to use Grid Chart in place of trellis and trellis chart is created from chart properties -> Dimension ->Trellis button.
Thanks & Regards
- Mark as New
- Bookmark
- Subscribe
- Mute
- Subscribe to RSS Feed
- Permalink
- Report Inappropriate Content
yes a trellis
see attachment