Unlock a world of possibilities! Login now and discover the exclusive benefits awaiting you.
Announcements
Save an extra $150 Dec 1–7 with code CYBERWEEK - stackable with early bird savings: Register
- Qlik Community
- :
- All Forums
- :
- QlikView App Dev
- :
- Why suppressing part of dimension?
Options
- Subscribe to RSS Feed
- Mark Topic as New
- Mark Topic as Read
- Float this Topic for Current User
- Bookmark
- Subscribe
- Mute
- Printer Friendly Page
Turn on suggestions
Auto-suggest helps you quickly narrow down your search results by suggesting possible matches as you type.
Showing results for
Not applicable
2014-08-18
06:17 AM
- Mark as New
- Bookmark
- Subscribe
- Mute
- Subscribe to RSS Feed
- Permalink
- Report Inappropriate Content
Why suppressing part of dimension?
Hi there,
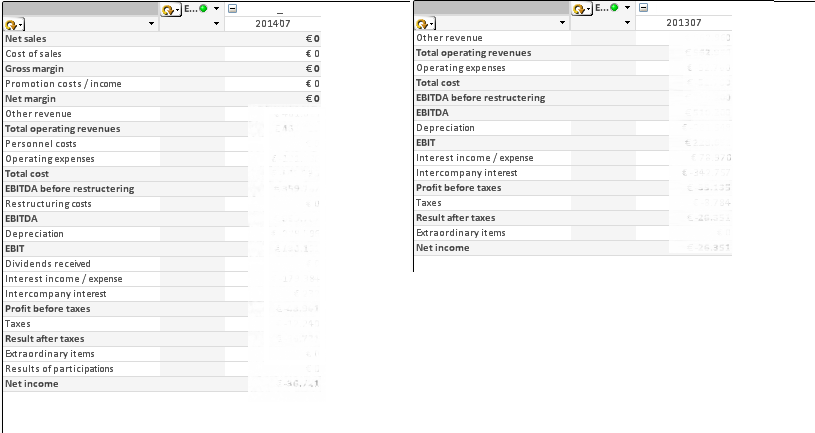
I'm having trouble with graphs supressing NULL or 0 values.
In the example you see the same graph for the same selection, except for the selection of the variable Year
(values are blurred for privacy).
The left graph shows all dimensions, even when values do not exist. The right graph supresses part of the dimension
when the values do not exist, showing a shorter graph.
The graphs are exactly the same, only the selection of year is different. Furthermore I already unchecked "Suppress Zero-Values" and "Supress Missing Values" and checked "Populate Missing Values".
Can someone explain what QlikView is doing?
233 Views
0 Replies