Unlock a world of possibilities! Login now and discover the exclusive benefits awaiting you.
- Qlik Community
- :
- All Forums
- :
- QlikView App Dev
- :
- Re: Win an e-book copy of Learning QlikView Data V...
- Subscribe to RSS Feed
- Mark Topic as New
- Mark Topic as Read
- Float this Topic for Current User
- Bookmark
- Subscribe
- Mute
- Printer Friendly Page
- Mark as New
- Bookmark
- Subscribe
- Mute
- Subscribe to RSS Feed
- Permalink
- Report Inappropriate Content
Win an e-book copy of Learning QlikView Data Visualization
This week I'm giving away three e-book copies of Learning QlikView Data Visualization.
To be eligible to win all you have to do is comment what data visualization method you would like to do in QlikView that you have not been able to do until now. It could either be a chart or a technique.
For example, I would like to do be able to do scatterplot matrices like the one below.
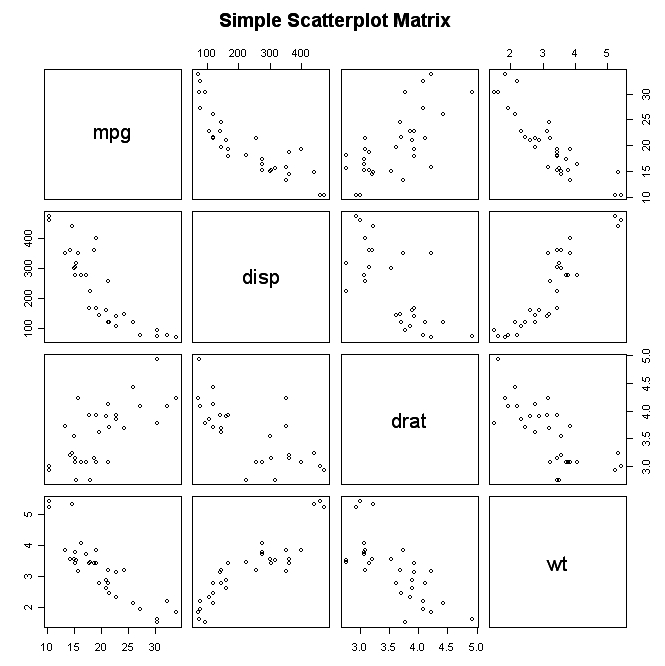
Don't forget to include a picture or link that explains the data visualization method you would like to do in QlikView.
Please respond by Monday, Nov. 4th and I will announce the winners on Wednesday, Nov. 6th after an old-fashioned drawing. Soon after the e-books will be delivered to the winners' e-mails as a Kindle e-book.
You don’t need a kindle to read the e-book. You can download the kindle application from amazon.com and view it from your laptop or iPad.
For more information, visit my blog http://bit.ly/18ATRLu.
Good luck!
- « Previous Replies
- Next Replies »
- Mark as New
- Bookmark
- Subscribe
- Mute
- Subscribe to RSS Feed
- Permalink
- Report Inappropriate Content
Dear Allan,
can you please guide me how you made this map with already open popup labels at Qlikview.
Thanks,
Farhan
- Mark as New
- Bookmark
- Subscribe
- Mute
- Subscribe to RSS Feed
- Permalink
- Report Inappropriate Content
Is the Gantt card interactive, so you can create new cases within QlikView?
- Mark as New
- Bookmark
- Subscribe
- Mute
- Subscribe to RSS Feed
- Permalink
- Report Inappropriate Content
Hi Farhan,
The image is not from Qlikview, it is from statistics on my youtube page where I make videos about Qlikview
I wish Qlikview could do that!
Regards
Al
- Mark as New
- Bookmark
- Subscribe
- Mute
- Subscribe to RSS Feed
- Permalink
- Report Inappropriate Content
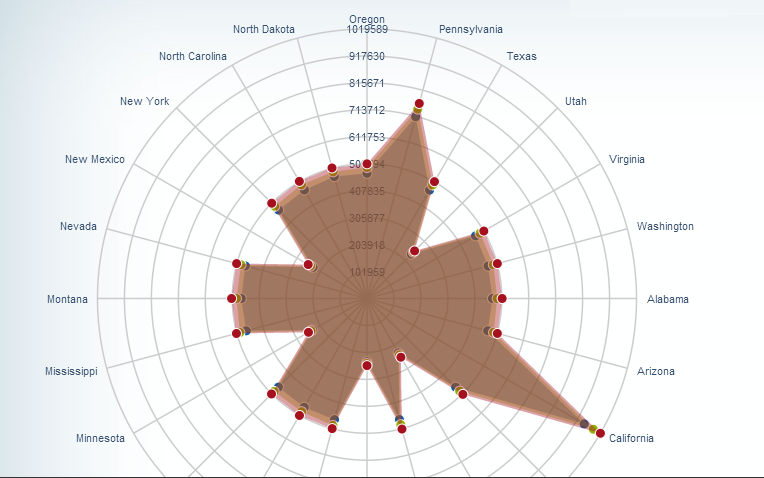
Hi Karl,
I would like to represent data in Radar Chart Format as below:
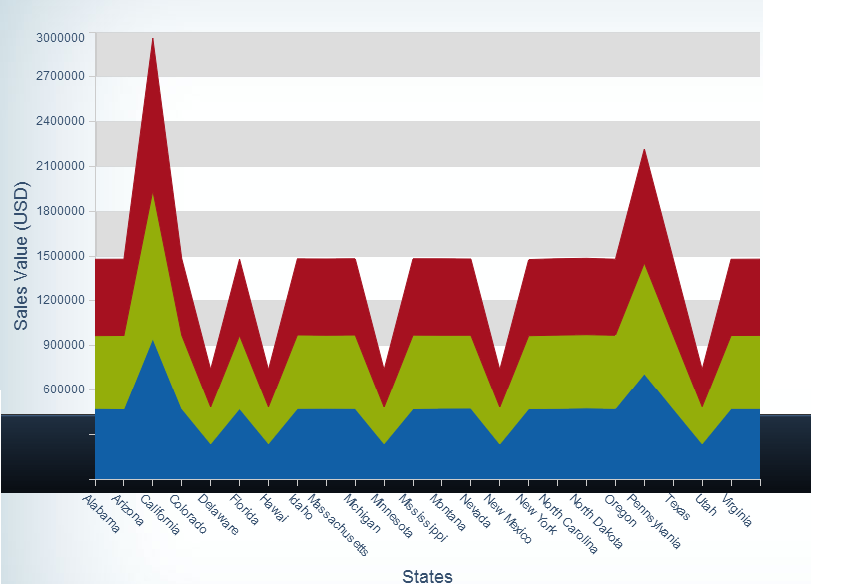
Also as Stacked Bar as below:
- Mark as New
- Bookmark
- Subscribe
- Mute
- Subscribe to RSS Feed
- Permalink
- Report Inappropriate Content
Hi Karl,
did you ever create a Qlikview app that reads/displays data from JIRA?
If so, would you be able to send me an example - i'm currently playing around with that now and would rather not re-invent the wheel..
Thanks in advance,
Matt
- Mark as New
- Bookmark
- Subscribe
- Mute
- Subscribe to RSS Feed
- Permalink
- Report Inappropriate Content
Hi Karl
I checked your method to create a parallel coordinate chart and found it very useful. I have a question now. Is it possible to now animate this parallel chart depending on one more dimension (say time)?
- « Previous Replies
- Next Replies »