Unlock a world of possibilities! Login now and discover the exclusive benefits awaiting you.
Announcements
Save an extra $150 Dec 1–7 with code CYBERWEEK - stackable with early bird savings: Register
- Qlik Community
- :
- All Forums
- :
- QlikView App Dev
- :
- Wrong data is getting calculated in chart
Options
- Subscribe to RSS Feed
- Mark Topic as New
- Mark Topic as Read
- Float this Topic for Current User
- Bookmark
- Subscribe
- Mute
- Printer Friendly Page
Turn on suggestions
Auto-suggest helps you quickly narrow down your search results by suggesting possible matches as you type.
Showing results for
Creator III
2018-06-22
08:13 AM
- Mark as New
- Bookmark
- Subscribe
- Mute
- Subscribe to RSS Feed
- Permalink
- Report Inappropriate Content
Wrong data is getting calculated in chart
Hi ,
I have sample data like this .
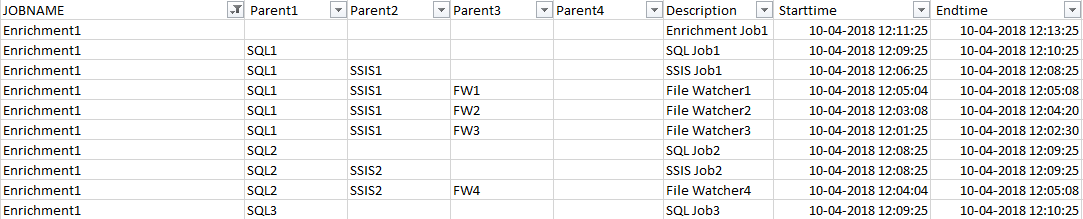
in expression I wrote max(endtime) - min(starttime) ,when I plot a chart , it is considering all the rows (10 rows) data .
However I want to show only highlight data difference .
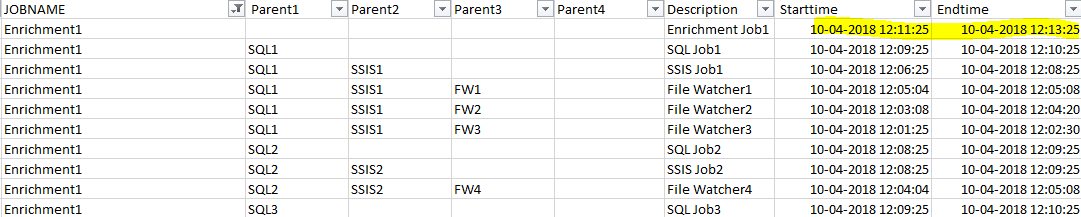
Please let me know where I am doing wrong.
405 Views
1 Reply
Anonymous
Not applicable
2018-06-22
12:35 PM
- Mark as New
- Bookmark
- Subscribe
- Mute
- Subscribe to RSS Feed
- Permalink
- Report Inappropriate Content
May be you should use AGGR function to aggregate data on your key field.
358 Views