Unlock a world of possibilities! Login now and discover the exclusive benefits awaiting you.
Announcements
Qlik Open Lakehouse is Now Generally Available! Discover the key highlights and partner resources here.
- Qlik Community
- :
- All Forums
- :
- QlikView App Dev
- :
- Re: X-axis auto scale
Options
- Subscribe to RSS Feed
- Mark Topic as New
- Mark Topic as Read
- Float this Topic for Current User
- Bookmark
- Subscribe
- Mute
- Printer Friendly Page
Turn on suggestions
Auto-suggest helps you quickly narrow down your search results by suggesting possible matches as you type.
Showing results for
Creator
2017-08-03
04:04 AM
- Mark as New
- Bookmark
- Subscribe
- Mute
- Subscribe to RSS Feed
- Permalink
- Report Inappropriate Content
X-axis auto scale
Hi!
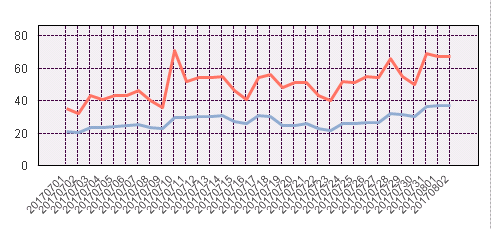
How can I adjust my chart to show e.g. every 2:nd date on the x-axis?
Showing every single date for one month makes the scale a little bit messy
912 Views
5 Replies
Creator III
2017-08-03
04:06 AM
- Mark as New
- Bookmark
- Subscribe
- Mute
- Subscribe to RSS Feed
- Permalink
- Report Inappropriate Content
You can use enable scroll at X-Axis from Presentation tab of chart properties.
822 Views
Creator
2017-08-03
04:30 AM
Author
- Mark as New
- Bookmark
- Subscribe
- Mute
- Subscribe to RSS Feed
- Permalink
- Report Inappropriate Content
It would be a possibility.
But I have a very similar graph that already has this x-axis auto scaling.
822 Views
Creator
2017-08-03
04:32 AM
Author
- Mark as New
- Bookmark
- Subscribe
- Mute
- Subscribe to RSS Feed
- Permalink
- Report Inappropriate Content
You can forget about this.
I reloaded the report and then the scale was OK
822 Views
Creator III
2017-08-03
04:33 AM
- Mark as New
- Bookmark
- Subscribe
- Mute
- Subscribe to RSS Feed
- Permalink
- Report Inappropriate Content
Chart size is also one of the factor for showing legend on axis.
822 Views
Specialist
2017-08-03
05:36 AM
- Mark as New
- Bookmark
- Subscribe
- Mute
- Subscribe to RSS Feed
- Permalink
- Report Inappropriate Content
you can adjust your chart size as attached in image.
822 Views