Unlock a world of possibilities! Login now and discover the exclusive benefits awaiting you.
- Qlik Community
- :
- All Forums
- :
- QlikView App Dev
- :
- Re: Years Total in MonthYear Chart
- Subscribe to RSS Feed
- Mark Topic as New
- Mark Topic as Read
- Float this Topic for Current User
- Bookmark
- Subscribe
- Mute
- Printer Friendly Page
- Mark as New
- Bookmark
- Subscribe
- Mute
- Subscribe to RSS Feed
- Permalink
- Report Inappropriate Content
Years Total in MonthYear Chart
Hello,
I was wondering if anyone can help me figure this out.
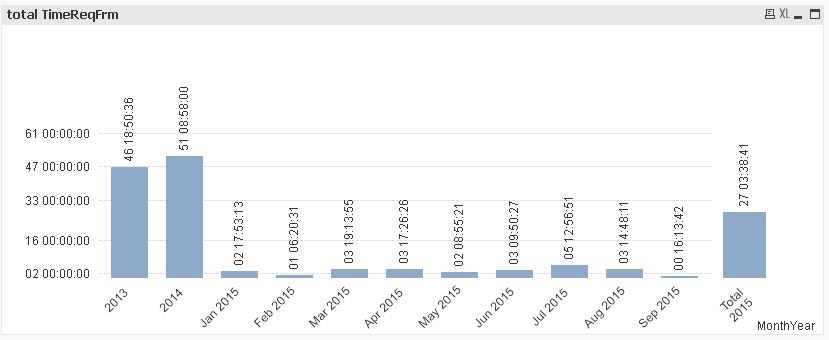
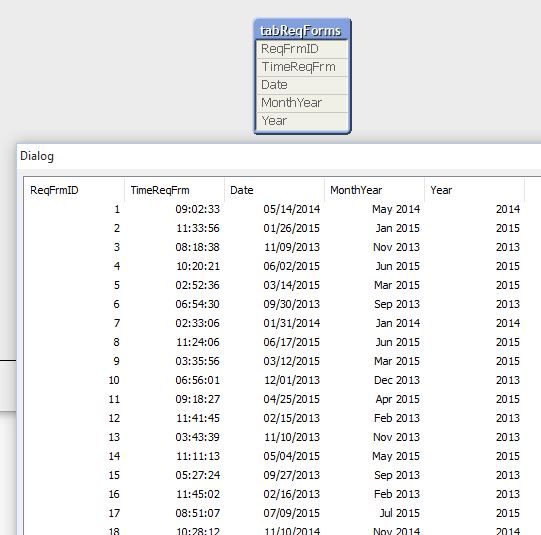
Im currently displaying the amount of time of requsition forms by the monthyear, with data from 2013 to 2015.
I was wondering how can i make a bar graph, that would have the first 2 bars the TOTAL time from 2013 and the TOTAL time from 2014, followed by the monthyears of 2015, till the date, and ended by a Current Total of 2015.
Am i being clear?
Is there any easy way of doing this?
thanks for your time
- Mark as New
- Bookmark
- Subscribe
- Mute
- Subscribe to RSS Feed
- Permalink
- Report Inappropriate Content
Create KPI in script by grouping your desired monthyears..
- Mark as New
- Bookmark
- Subscribe
- Mute
- Subscribe to RSS Feed
- Permalink
- Report Inappropriate Content
Hi,
one solution could be:
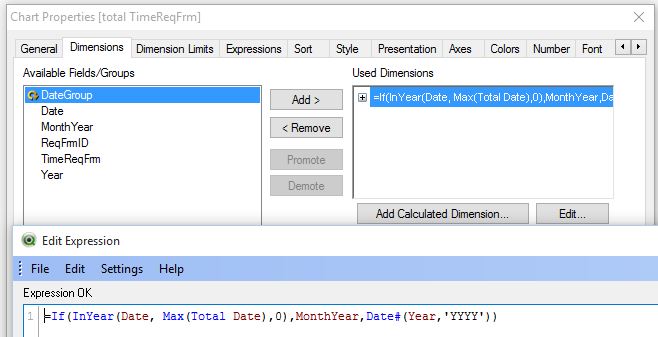
hope this helps
regards
Marco
- Mark as New
- Bookmark
- Subscribe
- Mute
- Subscribe to RSS Feed
- Permalink
- Report Inappropriate Content
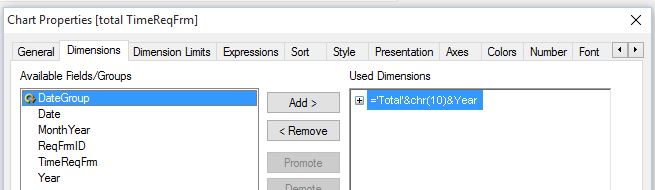
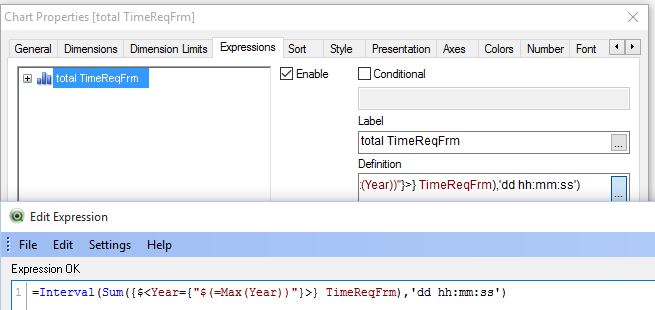
im sorry but i dont understand how u create the last column of Total 2015?
Is it on the expression? or where u edit that?
thanks
- Mark as New
- Bookmark
- Subscribe
- Mute
- Subscribe to RSS Feed
- Permalink
- Report Inappropriate Content
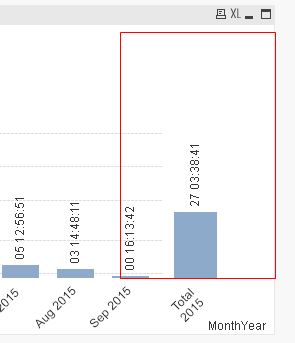
it's a separate transparent chart on top of the other chart.
regards
Marco
- Mark as New
- Bookmark
- Subscribe
- Mute
- Subscribe to RSS Feed
- Permalink
- Report Inappropriate Content
How to do this, if its not just one graph, but around 5 that minimize each other, how can i make the correct transparent graph to show?
thanks alot for the help