Unlock a world of possibilities! Login now and discover the exclusive benefits awaiting you.
- Qlik Community
- :
- All Forums
- :
- QlikView App Dev
- :
- accumulated line chart starting from zero
- Subscribe to RSS Feed
- Mark Topic as New
- Mark Topic as Read
- Float this Topic for Current User
- Bookmark
- Subscribe
- Mute
- Printer Friendly Page
- Mark as New
- Bookmark
- Subscribe
- Mute
- Subscribe to RSS Feed
- Permalink
- Report Inappropriate Content
accumulated line chart starting from zero
Hi everyone,
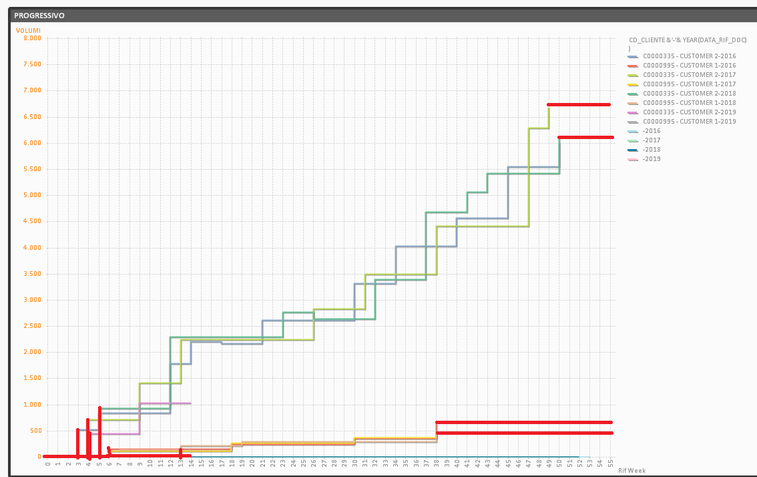
in a line chart I have to compare weekly comulative sales of two customers over the years
If i use only one dimension
=IF(DATA_RIF_DOC > makedate(year(AddYears(vDataFin, -2)), 1, 1),
WeekDualTC
)
lines starts from zero values
If I add another dimension
=IF(DATA_RIF_DOC > makedate(year(AddYears(vDataFin, -2)), 1, 1),
CD_CLIENTE &'-'& YEAR(DATA_RIF_DOC)
)
lines no longer start from zero
I have to add the second dimension because I have to see the data of the two customers over the years
Can someone help me?
Thanks,
- Mark as New
- Bookmark
- Subscribe
- Mute
- Subscribe to RSS Feed
- Permalink
- Report Inappropriate Content
It is still starts at zero, the problem is scale. The first dimension goes from 0 to 21, the second dimension starts around 500. If you very carefully put the cursor over the line near zero, you will see the first dimension. see image.
- Mark as New
- Bookmark
- Subscribe
- Mute
- Subscribe to RSS Feed
- Permalink
- Report Inappropriate Content
Thanks, maybe I explained myself wrongly
I need to arrive at a result like the following
in which chart lines start from x and y zero value (see the red lines)
It's possible to do it?
Thanks again

