Unlock a world of possibilities! Login now and discover the exclusive benefits awaiting you.
- Qlik Community
- :
- All Forums
- :
- QlikView App Dev
- :
- add total row (Calculated)
- Subscribe to RSS Feed
- Mark Topic as New
- Mark Topic as Read
- Float this Topic for Current User
- Bookmark
- Subscribe
- Mute
- Printer Friendly Page
- Mark as New
- Bookmark
- Subscribe
- Mute
- Subscribe to RSS Feed
- Permalink
- Report Inappropriate Content
add total row (Calculated)
Hi,
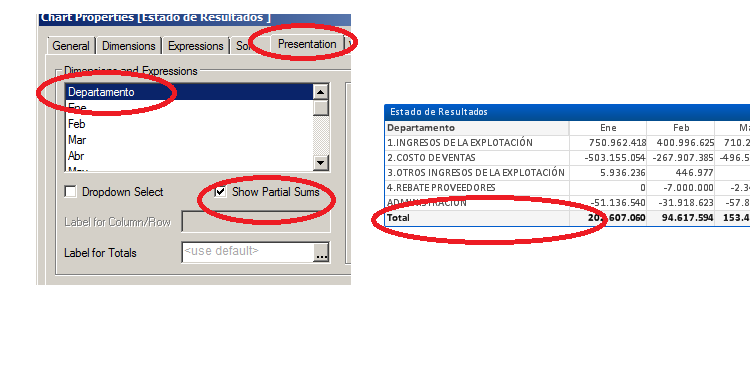
Searching into the forum I found an app from jagan who explain how to add a calculated row. I tried to do the same thing with my app but the total appears in the column: I would like sum top 3 elements. I dont want include ADMINISTRACIÓN. I attached the Jagan Sample and my app. Can you explain me how to do this... because total in my app appears in column.
| Departamento | Ene | Feb |
| 1.INGRESOS DE LA EXPLOTACIÓN | 750.962.418 | 400.996.625 |
| 2.COSTO DE VENTAS | -503.155.054 | -267.907.385 |
| 3.OTROS INGRESOS DE LA EXPLOTACIÓN | 5.936.236 | 446.977 |
| 4.REBATE PROVEEDORES | 0 | -7.000.000 |
| Total | 253.743.600 | 126.536.217 |
| ADMINISTRACIÓN | -51.136.540 | -31.918.623 |
Thanks!!
- « Previous Replies
-
- 1
- 2
- Next Replies »
Accepted Solutions
- Mark as New
- Bookmark
- Subscribe
- Mute
- Subscribe to RSS Feed
- Permalink
- Report Inappropriate Content
add the new pivottabledimension to the aggr as well:
Sum(Aggr(
If(cc_group_desc='1.INGRESOS DE LA EXPLOTACIÓN' or cc_group_desc='3.OTROS INGRESOS DE LA EXPLOTACIÓN'
or cc_group_desc='4.REBATES',Sum(ppto_clp_Real_01),Sum(ppto_clp_Real_01))*-1,cuenta,PivotTableDimension))
//Sum(ppto_clp_Real_01)
- Mark as New
- Bookmark
- Subscribe
- Mute
- Subscribe to RSS Feed
- Permalink
- Report Inappropriate Content
Hi.
Pivot tables totalize by the general expression.
In pressentation tab, check show partial sums, then it'll be automatic.
If the general expression does not give you the desired result, go like:
if (dimensionality()=0, Your Total Expression, Your Expression)
dimensionality()=0, means totals.
Pivot table with pivoted dimensions use also SecondaryDimensonality().
See dimenssionality in the help menu.
If you have all those expressions, just add them all.
Good luck.
- Mark as New
- Bookmark
- Subscribe
- Mute
- Subscribe to RSS Feed
- Permalink
- Report Inappropriate Content
Is it just this that you want ?

- Mark as New
- Bookmark
- Subscribe
- Mute
- Subscribe to RSS Feed
- Permalink
- Report Inappropriate Content
Hi again.
I think you need to dimension by Periodo.
Añade la dimensión periodo y luego chequea la casilla mostrar sumas parciales como te digo en el primero.
- Mark as New
- Bookmark
- Subscribe
- Mute
- Subscribe to RSS Feed
- Permalink
- Report Inappropriate Content
Hi Chris thsnk for you reply,
But in the jahan app doesn´t use dimensionality, if so, how it wold be the final expression?
if (dimensionality()=0, Column(1) + Column(2) ??+, Your Expression)
Thanks!
- Mark as New
- Bookmark
- Subscribe
- Mute
- Subscribe to RSS Feed
- Permalink
- Report Inappropriate Content
Hi Jonathan,
Is not what I want I just want obtain the total of
| 1.INGRESOS DE LA EXPLOTACIÓN | 750.962.418 | 400.996.625 |
| 2.COSTO DE VENTAS | -503.155.054 | -267.907.385 |
| 3.OTROS INGRESOS DE LA EXPLOTACIÓN | 5.936.236 | 446.977 |
| 4.REBATE PROVEEDORES | 0 | -7.000.000 |
I dont want to include ADMINISTRACIÓN
- Mark as New
- Bookmark
- Subscribe
- Mute
- Subscribe to RSS Feed
- Permalink
- Report Inappropriate Content
His expressions are rows, yours are columns, thats why you can´t obtain the same.
- Mark as New
- Bookmark
- Subscribe
- Mute
- Subscribe to RSS Feed
- Permalink
- Report Inappropriate Content
Hi Alejandra I know that, But how could obtain that? I can't figure out. I just have the similar scenario. One dimension and expressions.
Thanks!
- Mark as New
- Bookmark
- Subscribe
- Mute
- Subscribe to RSS Feed
- Permalink
- Report Inappropriate Content
Got it. I missed that in your first post.
One option which isn't extremely dynamic is to create a new field in the data model with a sort number for each value.
There would be some maintenance if the values change, but that would be the case for a chart based solution as well:
PivotTable:
load
cc_group_desc,
cc_group_desc as PivotTableDimension
if( cc_group_desc='Administration',6, left(cc_group_desc,1)) as SortNumber
resident <yourothertable>;
concatenate (PivotTable)
load
cc_group_desc,
'Total' as PivotTableDimension
5 as SortNumber
resident <yourothertable>
where
cc_group__desc <> 'Administration';
Use PivotTableDimension in the chart instead of cc_group_desc and sort on only(SortNumber) on the sort tab.
- Mark as New
- Bookmark
- Subscribe
- Mute
- Subscribe to RSS Feed
- Permalink
- Report Inappropriate Content
Ok, ther's a little problem in your model.
Anyway here is one solution.
about your model, I would cross those tables and also concat them. They have many fields in common
- « Previous Replies
-
- 1
- 2
- Next Replies »