Unlock a world of possibilities! Login now and discover the exclusive benefits awaiting you.
- Qlik Community
- :
- All Forums
- :
- QlikView App Dev
- :
- Re: aggregating maximum value with set analysis
- Subscribe to RSS Feed
- Mark Topic as New
- Mark Topic as Read
- Float this Topic for Current User
- Bookmark
- Subscribe
- Mute
- Printer Friendly Page
- Mark as New
- Bookmark
- Subscribe
- Mute
- Subscribe to RSS Feed
- Permalink
- Report Inappropriate Content
aggregating maximum value with set analysis
I have time based data that contains a few key columns as follows:
Time Stamp, device_id, status, latency, region, duration. Duration unit here is in seconds.
The status of the device could be in network or out of network.
The of status and duration indicate the status of the terminal, either in network or out of network and the duration simply shows the duration of that device either in network or out of network.
I'd like to create a chart showing total duration (in hours) of the device id when it is still considered in the network but the latency value is zero or blank. As it is reported periodically duration value keeps changing, so I'd like to select the maximum duration only for each device for each observation period. Tried set analysis like below with max value but it is not working.
sum({$<latency={"=len(trim(terminal_latency))=0"}, [status]={'*IN*'}, duration = {$(=max(duration))},[device_id]>}[duration])/3600
What is the correct expression for this? should this be better with advanced aggregation? Any suggestion?
- Mark as New
- Bookmark
- Subscribe
- Mute
- Subscribe to RSS Feed
- Permalink
- Report Inappropriate Content
Hi Fikri,
Try this:
Sum(Aggr(
sum({$<latency={"=len(trim(terminal_latency))=0"}, [status]={'*IN*'}, duration = {$(=max(duration))},[device_id]>}[duration]),[device_id]))/3600
You will calculate max duration for each device_id
Regards!
- Mark as New
- Bookmark
- Subscribe
- Mute
- Subscribe to RSS Feed
- Permalink
- Report Inappropriate Content
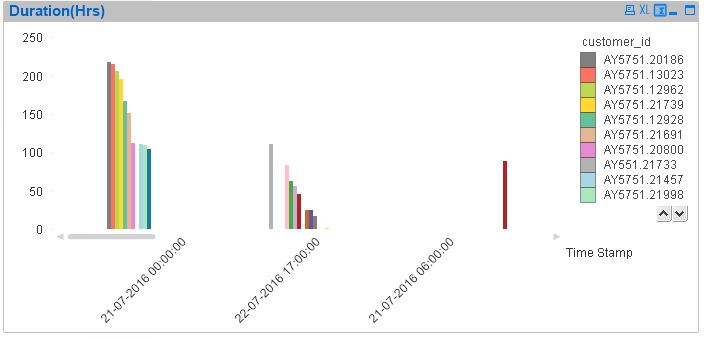
Hi, I am still using personal version and unable to open the file. I wonder if it is possible to show the script and expressions used in the chart? and also a capture of the chart itself so that I can understand if it is what I am looking for.
- Mark as New
- Bookmark
- Subscribe
- Mute
- Subscribe to RSS Feed
- Permalink
- Report Inappropriate Content
This expression is not showing any result although it shows OK.
- Mark as New
- Bookmark
- Subscribe
- Mute
- Subscribe to RSS Feed
- Permalink
- Report Inappropriate Content
Here is the script -
Source:
Load Date,
Time,
Timestamp(floor(Timestamp#(Date&' '&Time,'DD-MM-YYYY hh:mm:ss'),1/24),'DD-MM-YYYY hh:mm:ss') as [Time Stamp],
[network id],
[area number],
customer_id,
type,
Status,
latency,
region,
rangesum(subfield(Duration,':',-1),subfield(Duration,':',-2)*60,subfield(Duration,':',-3)*3600,subfield(Duration,':',-4)*86400)/3600 as Duration
;
LOAD Date(Date#(Date,'DD/MM/YYYY'),'DD-MM-YYYY') as Date,
Time,
[network id],
[area number],
customer_id,
type,
Status,
if(wildMatch(trim(Status),'*IN_NETWORK*'),replace(KeepChar(Status,'0123456789 '),' ',':'),0)
as Duration,
latency,
region
FROM
[Data_Sample for qlik2..csv]
(txt, codepage is 1252, embedded labels, delimiter is ',', msq);
- Mark as New
- Bookmark
- Subscribe
- Mute
- Subscribe to RSS Feed
- Permalink
- Report Inappropriate Content
Dimension -
Timestamp and customer_id
Expression
Max(Aggr(Max({$<latency={"=len(trim(latency))=0"},Duration = {">0"}>}Duration),[network id]))
I think expression needs improvement 
- Mark as New
- Bookmark
- Subscribe
- Mute
- Subscribe to RSS Feed
- Permalink
- Report Inappropriate Content
Try this, i used Interval to show it into seconds.
Interval(Sum(Aggr(max({$<latency={0},[Status]={'*IN*'},[network id]>} Time),[network id])),'ss')
Regards!
- Mark as New
- Bookmark
- Subscribe
- Mute
- Subscribe to RSS Feed
- Permalink
- Report Inappropriate Content
Thanks Digvijay,
Actually I just want to have a simple one. So, in this case the dimension is just simply time, not necessary with customer_id. What I want to see in the chart is the Total sum of maximum duration for each customer when the latency is null or blank. In other words, I just want to select the maximum value for each customer for that duration. If the selected time interval is hour, then select the maximum value for that customer within that hour and aggregate/sum with the max value for all other customers within that period. If the time selection is one, this will become the max value for one day.
The x axis or dimension can be hour or day depending on the selection. I do this by selecting the predefined interval in the script.
Does this expression
Max(Aggr(Max({$<latency={"=len(trim(latency))=0"},Duration = {">0"}>}Duration),[network id])) do this job?
I was thinking something like:
Aggr(Max({$<latency={"=len(trim(latency))=0"},Duration = {">0"}, [status]={'*IN*'},>}Duration),[customer_Id] but not sure if this gives the result I wanted since some days show zero results where I know there are some values on those days.
Any suggestion?
- Mark as New
- Bookmark
- Subscribe
- Mute
- Subscribe to RSS Feed
- Permalink
- Report Inappropriate Content
Or this one - if I wanted to aggregate it by date
Max(Aggr(Max({$<latency={"=len(trim(latency))=0"},[Duration] = {">0"},[Status]={'*IN*'}>}[Duration]),Date,[Customer_Id]))/3600
The unit will in hour
- Mark as New
- Bookmark
- Subscribe
- Mute
- Subscribe to RSS Feed
- Permalink
- Report Inappropriate Content
Have you seen my response?
Use this expression:
Interval(Sum(Aggr(max({$<latency={0},[Status]={'*IN*'},[network id]>} Time),[network id])),'ss')
If you want to see it in hours change ss with hh
Regards!
- Mark as New
- Bookmark
- Subscribe
- Mute
- Subscribe to RSS Feed
- Permalink
- Report Inappropriate Content
HI,
I did try this one with sample file and script from Digvijay. This is not showing any data regardless of ss or hh.
What is the dimension in this case?
Interval(Sum(Aggr(max({$<latency={0},[Status]={'*IN*'},[network id]>} Time),[network id])),'ss')
The above seems aggregating by network_id
I'd like to sum max value of duration with selected condition (latency is blank and customer in network) by customer_id over period of time)