Unlock a world of possibilities! Login now and discover the exclusive benefits awaiting you.
- Qlik Community
- :
- All Forums
- :
- QlikView App Dev
- :
- Re: aggregating maximum value with set analysis
- Subscribe to RSS Feed
- Mark Topic as New
- Mark Topic as Read
- Float this Topic for Current User
- Bookmark
- Subscribe
- Mute
- Printer Friendly Page
- Mark as New
- Bookmark
- Subscribe
- Mute
- Subscribe to RSS Feed
- Permalink
- Report Inappropriate Content
aggregating maximum value with set analysis
I have time based data that contains a few key columns as follows:
Time Stamp, device_id, status, latency, region, duration. Duration unit here is in seconds.
The status of the device could be in network or out of network.
The of status and duration indicate the status of the terminal, either in network or out of network and the duration simply shows the duration of that device either in network or out of network.
I'd like to create a chart showing total duration (in hours) of the device id when it is still considered in the network but the latency value is zero or blank. As it is reported periodically duration value keeps changing, so I'd like to select the maximum duration only for each device for each observation period. Tried set analysis like below with max value but it is not working.
sum({$<latency={"=len(trim(terminal_latency))=0"}, [status]={'*IN*'}, duration = {$(=max(duration))},[device_id]>}[duration])/3600
What is the correct expression for this? should this be better with advanced aggregation? Any suggestion?
- « Previous Replies
- Next Replies »
- Mark as New
- Bookmark
- Subscribe
- Mute
- Subscribe to RSS Feed
- Permalink
- Report Inappropriate Content
Hi,
If you see the script, I have ruled out other than IN_NETWORK status for calculation of duration, as you said I have removed the customer_id dimension. Now I think the chart sums the max values customer wise for a timestamp dim. I think now you can take it from here.
Sharing some screen prints to prove my stand -

If you see I have selected 2 customers, specific timestamp also selected just to verify the data, with latency 0 selected, also having duration >0 selected, the status column verifies that only IN_NETWORK status are selected. It proves that script is working fine.
Now here is the chart -
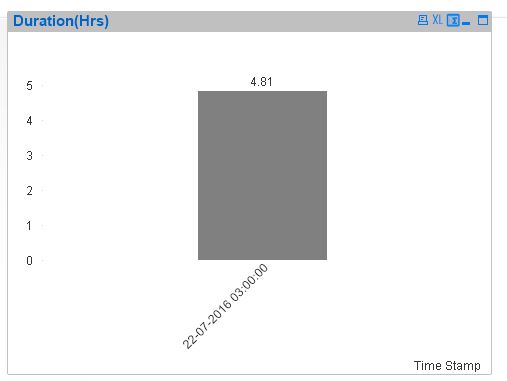
as per first image -
Max duration for first customer - 1845 secs
Max duration for sec customer - 15477 secs
Sum of max against time period = 4.81 hrs or 17322 sec, the chart also shows the same amount.
So along with script the expression used is -
Sum(Aggr(Max({$<latency={"=len(trim(latency))=0"},Duration = {">0"}>}Duration/3600),[Time Stamp],customer_id))
Script with some small modification is -
Source:
Load Date,
Time,
Timestamp(floor(Timestamp#(Date&' '&Time,'DD-MM-YYYY hh:mm:ss'),1/24),'DD-MM-YYYY hh:mm:ss') as [Time Stamp],
[network id],
[area number],
customer_id,
type,
Status,
latency,
region,
rangesum(subfield(Duration,':',-1),subfield(Duration,':',-2)*60,subfield(Duration,':',-3)*3600,subfield(Duration,':',-4)*86400) as Duration
;
LOAD Date(Date#(Date,'DD/MM/YYYY'),'DD-MM-YYYY') as Date,
Time,
[network id],
[area number],
customer_id,
type,
Status,
if(wildMatch(trim(Status),'*IN_NETWORK*'),replace(KeepChar(Status,'0123456789 '),' ',':'),0)
as Duration,
latency,
region
FROM
[Data_Sample for qlik2..csv]
(txt, codepage is 1252, embedded labels, delimiter is ',', msq);
Hope this helps.
- Mark as New
- Bookmark
- Subscribe
- Mute
- Subscribe to RSS Feed
- Permalink
- Report Inappropriate Content
Hi,
On script I have set lantency to 0 when is null. You can use all dimensions do you want, I used network and date.
Regards!
- Mark as New
- Bookmark
- Subscribe
- Mute
- Subscribe to RSS Feed
- Permalink
- Report Inappropriate Content
OK, thanks!
- « Previous Replies
- Next Replies »