Unlock a world of possibilities! Login now and discover the exclusive benefits awaiting you.
- Qlik Community
- :
- All Forums
- :
- QlikView App Dev
- :
- average comparison if statement
- Subscribe to RSS Feed
- Mark Topic as New
- Mark Topic as Read
- Float this Topic for Current User
- Bookmark
- Subscribe
- Mute
- Printer Friendly Page
- Mark as New
- Bookmark
- Subscribe
- Mute
- Subscribe to RSS Feed
- Permalink
- Report Inappropriate Content
average comparison if statement
I am wondering what is the best way to show a comparison to the previous 13 weeks.
I want to show the most recent 13 week average but cannot get my if statement correct - can someone please help?
count(if(week<max(week) and week>=max(week)-14 and answered='Yes',answered))
- Mark as New
- Bookmark
- Subscribe
- Mute
- Subscribe to RSS Feed
- Permalink
- Report Inappropriate Content
Something like below
=SUM({<WeekNum = {'<=$(Week(Today()))>=$(=Week(Today())-13)'}>}Amount)/13
Change your field names accordingly...
- Mark as New
- Bookmark
- Subscribe
- Mute
- Subscribe to RSS Feed
- Permalink
- Report Inappropriate Content
i suppose to make max(date) in a script as a variable:
LET vMaxWeek = max(week)
LET vLowerWeek = max(week)-14
then use the variables in set analysis, beacuse its more efficent than if statement 
- Mark as New
- Bookmark
- Subscribe
- Mute
- Subscribe to RSS Feed
- Permalink
- Report Inappropriate Content
try to define variable for the max week,
vMaxWeek = Max(week)
and use set analysis expression
=$(='count({<week={"<'& vMaxWeek & ' >=' & vMaxWeek-14 & '"}, answered={'Yes'}>}answered)')
- Mark as New
- Bookmark
- Subscribe
- Mute
- Subscribe to RSS Feed
- Permalink
- Report Inappropriate Content
Guys think about what you're saying..
In Week 8 F.E.
max(Week)-14 would be -6...
I'll provide you with a more efficient solution ASAP.
-Patrick
- Mark as New
- Bookmark
- Subscribe
- Mute
- Subscribe to RSS Feed
- Permalink
- Report Inappropriate Content
I think this might be along the right steps but unfortunately I don't know enough about variables or set analysis.
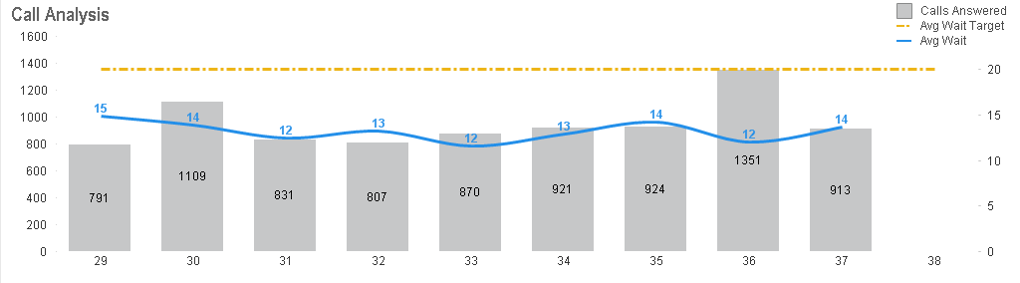
The graph I am trying to plot the average on is has weeks as a dimension. I want a sold line across the graph that shows what the average weekly number of calls answered have been over the past 13 weeks - regardless of what weeks the user selects
- Mark as New
- Bookmark
- Subscribe
- Mute
- Subscribe to RSS Feed
- Permalink
- Report Inappropriate Content