Unlock a world of possibilities! Login now and discover the exclusive benefits awaiting you.
- Qlik Community
- :
- All Forums
- :
- QlikView App Dev
- :
- Re: avg expression of specific months
- Subscribe to RSS Feed
- Mark Topic as New
- Mark Topic as Read
- Float this Topic for Current User
- Bookmark
- Subscribe
- Mute
- Printer Friendly Page
- Mark as New
- Bookmark
- Subscribe
- Mute
- Subscribe to RSS Feed
- Permalink
- Report Inappropriate Content
avg expression of specific months
Hi everybody
im working on a dashboard which has "YearMonth" field from the data source (month+year), i want to calculate a percentage based on the average of "sum([VISITS])" of months may-18, june-18 and july-18 and compare them with august-18.
I wanna know if there was a growth or not. How do i "separate" the months to select JUST the ones i want?
Thanks in advance
- Subscribe by Topic:
-
average
-
avg
-
calculation
-
expression
-
month
-
QlikView App
-
sum
-
year
- Mark as New
- Bookmark
- Subscribe
- Mute
- Subscribe to RSS Feed
- Permalink
- Report Inappropriate Content
If the yearmonth field have values like 201805,201806,201807,201808.
Expression of growth would be
=(sum({<yearmonth={"=max(yearmonth)"}>}VISITS)
/
(Sum({<yearmonth={">=max(yearmonth)-3 <max(yearmonth)"}>}VISITS)/3)
)-1
- Mark as New
- Bookmark
- Subscribe
- Mute
- Subscribe to RSS Feed
- Permalink
- Report Inappropriate Content
Hi, it didn't work, when I use your formula it brings me back "1" as the result. I attach you an image of the "yearmonth" list
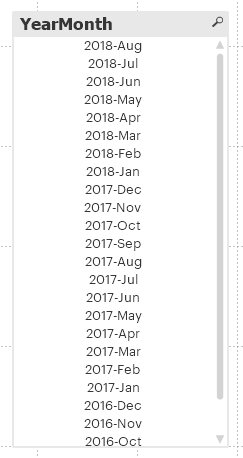
- Mark as New
- Bookmark
- Subscribe
- Mute
- Subscribe to RSS Feed
- Permalink
- Report Inappropriate Content
Hi,
Try this one
((sum({<yearmonth={"=DATE(max(DATE(DATE#(yearmonth,'YYYY-MMM'))),'YYYY-MMM')"}>}VISITS) / (Sum({<yearmonth={">=DATE(max(DATE(DATE#(yearmonth,'YYYY-MMM')))-3 ,'YYYY-MMM')<DATE(max(DATE(DATE#(yearmonth,'YYYY-MMM'))),'YYYY-MMM')"}>}VISITS)/3) )-1)*100
- Mark as New
- Bookmark
- Subscribe
- Mute
- Subscribe to RSS Feed
- Permalink
- Report Inappropriate Content
Thank you, with little changes i could make it work!