Unlock a world of possibilities! Login now and discover the exclusive benefits awaiting you.
- Qlik Community
- :
- All Forums
- :
- QlikView App Dev
- :
- Re: background colours
- Subscribe to RSS Feed
- Mark Topic as New
- Mark Topic as Read
- Float this Topic for Current User
- Bookmark
- Subscribe
- Mute
- Printer Friendly Page
- Mark as New
- Bookmark
- Subscribe
- Mute
- Subscribe to RSS Feed
- Permalink
- Report Inappropriate Content
background colours
Hi all,
can someone tell if its possibl;e and if so how to define the background colour of a chart by the dimension.
ok so to clear things up use the below example;
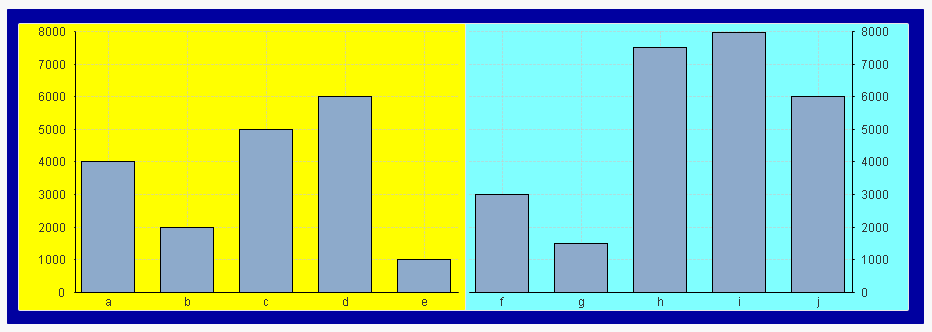
i have 10 dimensions in a chart A,B,C,D,E,F,G,H,I,J
Dimensions A-E are in group 1, dimensions F-J are group 2.
on my chart it would be nice if the background of the first group was 1 colour and group 2 another colour.
therefre if i clear the filters my chart will show all 10 dimensions and will have 2 background colours.
thanks for any help
- Tags:
- new_to_qlikview
- Mark as New
- Bookmark
- Subscribe
- Mute
- Subscribe to RSS Feed
- Permalink
- Report Inappropriate Content
You can set the background color for each dimension individually or all dimensions at once. In the User Preferences on the Design enable the option Always show Design Menu Items. Then right click a cell in a dimension column and choose Custom Format Cell. You can then change the background color for that dimension or apply it to all dimension. You can first set the background color for all dimensions and then change the background color for the five dimensions of one group.
The other way is to use the formatting options on the Dimensions tab. Click on the + in front of the dimension on the Dimensions tab, select Background Color and click the Edit button to enter an expression that calculates a color. For example =color(1) or =lightred(). You'll have to do that for each dimension. It's not possible to do it at once for a group of dimensions.
talk is cheap, supply exceeds demand
- Mark as New
- Bookmark
- Subscribe
- Mute
- Subscribe to RSS Feed
- Permalink
- Report Inappropriate Content
On Dimension tab -- click on + symbol ans define colors as ur like,do for all dimensions the same.
and apply same color for group1 dimensions & apply different same color for group2 dimeions
- Mark as New
- Bookmark
- Subscribe
- Mute
- Subscribe to RSS Feed
- Permalink
- Report Inappropriate Content
I think that this may give you somewhere close to what you require:
It is think round the problem and is a bit of a cheat but I think probably comes close. I have attached the application so that you can see the inner workings.