Unlock a world of possibilities! Login now and discover the exclusive benefits awaiting you.
- Qlik Community
- :
- All Forums
- :
- QlikView App Dev
- :
- bar chart with 2 dimensions and 2 formulas
- Subscribe to RSS Feed
- Mark Topic as New
- Mark Topic as Read
- Float this Topic for Current User
- Bookmark
- Subscribe
- Mute
- Printer Friendly Page
- Mark as New
- Bookmark
- Subscribe
- Mute
- Subscribe to RSS Feed
- Permalink
- Report Inappropriate Content
bar chart with 2 dimensions and 2 formulas
Hello everyone
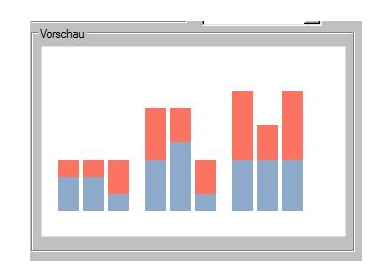
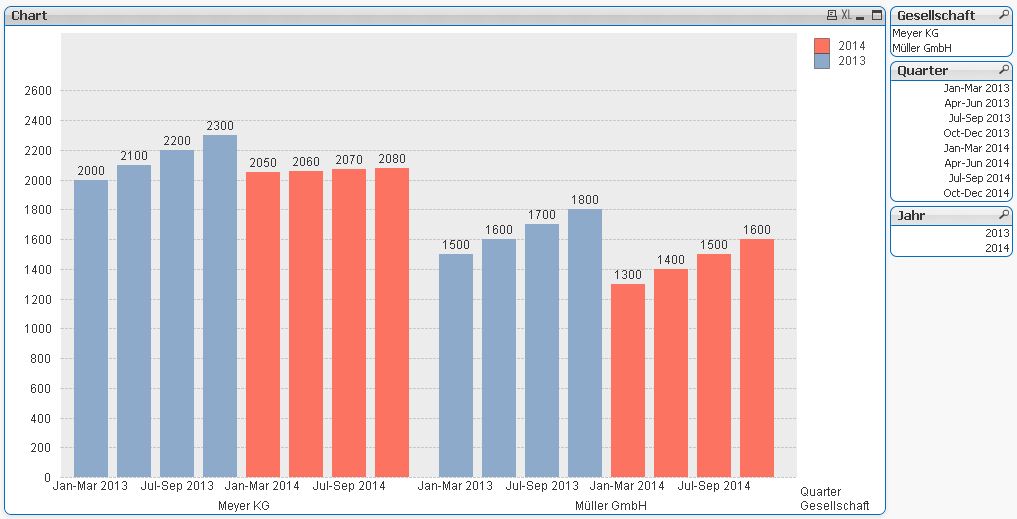
Is it possible to create a bar chart with 2 dimensions, say business unit and year and compare the sum of the earnings from the current and the last year?
When I try to create this chart the two sums are stacked. I am not able to separate the two sums. They remain stacked in the same bar...
Thank you for your help!
Jan
Accepted Solutions
- Mark as New
- Bookmark
- Subscribe
- Mute
- Subscribe to RSS Feed
- Permalink
- Report Inappropriate Content
Hi,
please mark this thread answered, if there are no further questions.
thanks
regards
Marco
- Mark as New
- Bookmark
- Subscribe
- Mute
- Subscribe to RSS Feed
- Permalink
- Report Inappropriate Content
Hi,
Could you post a sample if possible??
Kiru
- Mark as New
- Bookmark
- Subscribe
- Mute
- Subscribe to RSS Feed
- Permalink
- Report Inappropriate Content
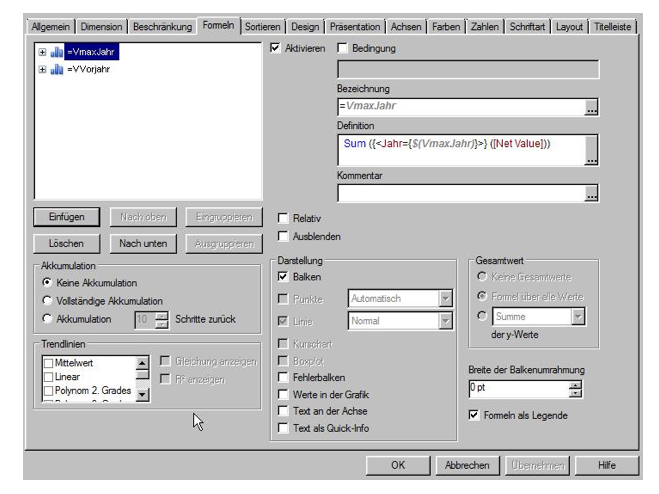
Hi Kiru
maybe these screeshots help to explain:

- Mark as New
- Bookmark
- Subscribe
- Mute
- Subscribe to RSS Feed
- Permalink
- Report Inappropriate Content
If I understood your problem correctly, I have done a sample example, please have a look at it.
Let me know if I am wrong.
Kiru
- Mark as New
- Bookmark
- Subscribe
- Mute
- Subscribe to RSS Feed
- Permalink
- Report Inappropriate Content
Justo go to Properties of the chart, select STYLE, and then in SUBTYPE select GROUPED.
Like this: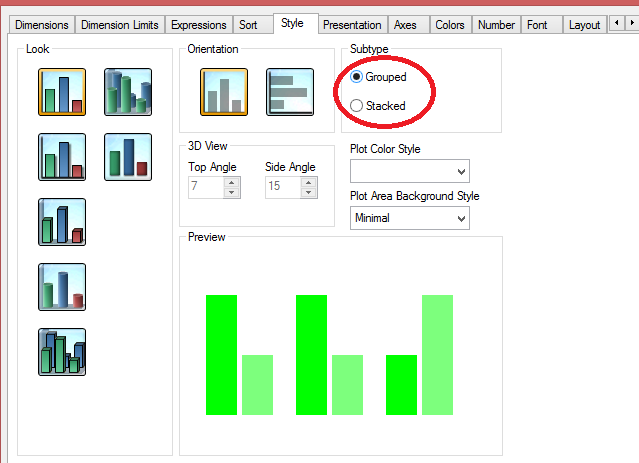
- Mark as New
- Bookmark
- Subscribe
- Mute
- Subscribe to RSS Feed
- Permalink
- Report Inappropriate Content
Hi Ramiro
Weired thing is, "grouped" is selected...
Best
Jan
- Mark as New
- Bookmark
- Subscribe
- Mute
- Subscribe to RSS Feed
- Permalink
- Report Inappropriate Content
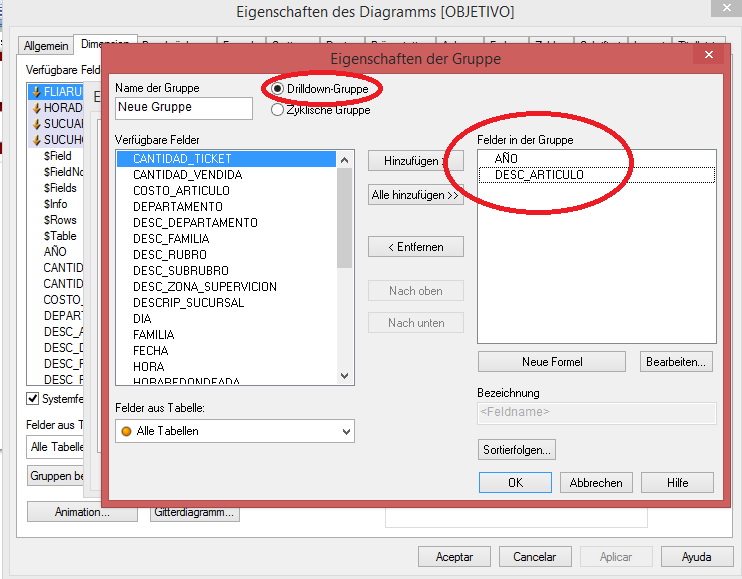
Ok, i've solved you problem 
Go to the dimentions tab, "edit groups", create a new "drill-down-group" with the dimentions of the chart. Delete the dimentions and add the group as the only dimention.
It should work!
Editing with images in german: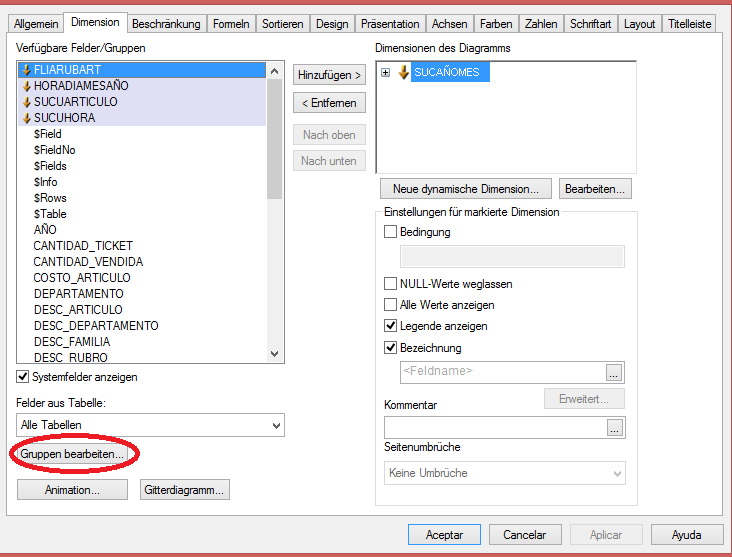
- Mark as New
- Bookmark
- Subscribe
- Mute
- Subscribe to RSS Feed
- Permalink
- Report Inappropriate Content
Hallo Jan,
one possible solution might be:
hope this helps
Gruß
Marco
- Mark as New
- Bookmark
- Subscribe
- Mute
- Subscribe to RSS Feed
- Permalink
- Report Inappropriate Content
True, thank you.
- Mark as New
- Bookmark
- Subscribe
- Mute
- Subscribe to RSS Feed
- Permalink
- Report Inappropriate Content
Hi,
please mark this thread answered, if there are no further questions.
thanks
regards
Marco