Unlock a world of possibilities! Login now and discover the exclusive benefits awaiting you.
- Qlik Community
- :
- All Forums
- :
- QlikView App Dev
- :
- blank field to be used in expression
- Subscribe to RSS Feed
- Mark Topic as New
- Mark Topic as Read
- Float this Topic for Current User
- Bookmark
- Subscribe
- Mute
- Printer Friendly Page
- Mark as New
- Bookmark
- Subscribe
- Mute
- Subscribe to RSS Feed
- Permalink
- Report Inappropriate Content
blank field to be used in expression
Hi all,
I'm relatively new to qv and I need your help!
First issue:
Let's say I have this table
| Category | TY | LY | FC | ΔLY(%) | ΔFC(%) |
| TURNOVER | 82,547 | 76,214 | 80,470 | 8% | 3% |
| DIRECT COSTS | -16,385 | -18,027 | -18,636 | -9% | -12% |
| OVERHEADS | -22,753 | -26,155 | -23,239 | -13% | -2% |
| DEPRECIATION | -6,694 | -6,694 | -6,694 | 0% | 0% |
| - | -40 | -14,108 | -252 | -100% | -84% |
| Profit | 36,675 | 11,229 | 31,649 | 227% | 16% |
I need to use the field - (category column) in set analysis in order to calculate some metrics. Please note that the source excel table I has only the following fields: Turnover,direct costs, overheads and depreciation. I assume that the - field is just blank in my source table. So how do I use this field in set analysis?
I have tried Sum({$<YEAR#={2014},Category={''}>}Actual#) and Sum({$<YEAR#={2014},Category={'-'}>}Actual#) with no luck.
Second issue: The profit field (bottom category column) was created using partial sum under presentation tab.
Can I for example do the same for Turnover minus Direct costs and have a new field lnamed Gross Margin (TURNOVER - DIRECT COSTS) without having to do serious scripting work?
Thank you for your time fellas
- « Previous Replies
-
- 1
- 2
- Next Replies »
- Mark as New
- Bookmark
- Subscribe
- Mute
- Subscribe to RSS Feed
- Permalink
- Report Inappropriate Content
I think this document might help you understand the first issue: NULL handling in QlikView
The second issue will need some scripting work. I don't know what you consider 'serious' scripting work. Some would say any scripting is serious or it shouldn't be done. What's probably easiest is create an extra table that groups the categories:
Group, Category
Turnover, Turnover
Direct Costs, Direct Costs
Overheads, Overheads
Depreciation, Depreciation
Gross Margin, Turnover
Gross Margin, Direct Costs
Profit, Turnover
Profit, Direct Costs
Profit, Overheads
Profit, Depreciation
Then use the Group field as dimension instead of Category
talk is cheap, supply exceeds demand
- Mark as New
- Bookmark
- Subscribe
- Mute
- Subscribe to RSS Feed
- Permalink
- Report Inappropriate Content
thank you for your fast response Gysbert. Will give it a go and come back to you
- Mark as New
- Bookmark
- Subscribe
- Mute
- Subscribe to RSS Feed
- Permalink
- Report Inappropriate Content
Hi Gysbert,
I've read the document you recommended and then tried various expressions in set analysis like the E and the nullcount function with no luck.
Any ideas?
Thank again
- Mark as New
- Bookmark
- Subscribe
- Mute
- Subscribe to RSS Feed
- Permalink
- Report Inappropriate Content
Can you post a small document that demonstrates the problem? See this document if you're worried about confidentiality: Preparing examples for Upload - Reduction and Data Scrambling
talk is cheap, supply exceeds demand
- Mark as New
- Bookmark
- Subscribe
- Mute
- Subscribe to RSS Feed
- Permalink
- Report Inappropriate Content
Hi,
managed to solve the first problem using the following expression:sum({($ -<Category={'*'}>) * <YEAR#={'2014'}>}Actual#).
Thank you for posting the document about Null handling. You showed me where to look at!
Now regarding the second issue I'll try to be more precise:
| Category | TY | LY | FC | ΔLY(%) | ΔFC(%) |
| TURNOVER | 12,071 | 12,557 | 12,808 | -4% | -6% |
| DIRECT COSTS | -3,669 | -3,438 | -3,575 | 7% | 3% |
| OVERHEADS | -3,814 | -3,038 | -3,060 | 26% | 25% |
| DEPRECIATION | -604 | -604 | -604 | 0% | 0% |
| Profit | 3,984 | 5,477 | 5,569 | -27% | -28% |
| GM(%) TY | 70% |
| GM(%) LY | 73% |
| GM(%) FC | 72% |
| GM(%) ΔLY | -3% |
| GM(%) ΔFC | -2% |
| ROS(%) TY | 33% |
| ROS(%) LY | 44% |
| ROS(%) FC | 43% |
| ROS(%) ΔLY | -11% |
| ROS(%) ΔFC | -10% |
Can I make the second table look like the first?
The thing is I don't have any dimensions since everything in the second table is calculated.
Is it possible to show the second table as:
| Category | TY | LY | FC | ΔLY(%) | ΔFC(%) |
| GM (% | 70% | 73% | 72% | -3% | -2% |
| ROS(%) | 33% | 44% | 43% | -11% | -10% |
Thanks!
- Mark as New
- Bookmark
- Subscribe
- Mute
- Subscribe to RSS Feed
- Permalink
- Report Inappropriate Content
Dear,
kindly find the attached file .
i hope it will help you.
Thanks,
Mukram@
- Mark as New
- Bookmark
- Subscribe
- Mute
- Subscribe to RSS Feed
- Permalink
- Report Inappropriate Content
Hi Mukram,
Unfortunately I am using PE. Is there any other way to get my hands on the information you have posted?
Thanks!
- Mark as New
- Bookmark
- Subscribe
- Mute
- Subscribe to RSS Feed
- Permalink
- Report Inappropriate Content
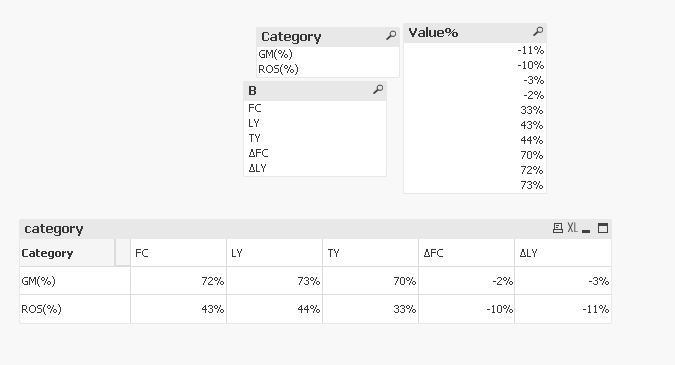
Dear,
One:
LOAD * INLINE [
Categorys, Value%
GM(%) TY ,70%
GM(%) LY ,73%
GM(%) FC ,72%
GM(%) ΔLY ,-3%
GM(%) ΔFC ,-2%
ROS(%) TY ,33%
ROS(%) LY ,44%
ROS(%) FC ,43%
ROS(%) ΔLY ,-11%
ROS(%) ΔFC ,-10%
];
LOAD *,
SubField(Categorys,' ',1) as Category,
SubField(Categorys,')',2) as B
Resident One;
DROP Table One;
then use the pivot table like below,
- Mark as New
- Bookmark
- Subscribe
- Mute
- Subscribe to RSS Feed
- Permalink
- Report Inappropriate Content
Hi,
But this is just for one selection (static) right?
I need this table to show these metrics (GM, ROS) for any selection I make.
Is this possible?
Thanks again
- « Previous Replies
-
- 1
- 2
- Next Replies »