Unlock a world of possibilities! Login now and discover the exclusive benefits awaiting you.
- Qlik Community
- :
- All Forums
- :
- QlikView App Dev
- :
- Re: box plot and formatting values
- Subscribe to RSS Feed
- Mark Topic as New
- Mark Topic as Read
- Float this Topic for Current User
- Bookmark
- Subscribe
- Mute
- Printer Friendly Page
- Mark as New
- Bookmark
- Subscribe
- Mute
- Subscribe to RSS Feed
- Permalink
- Report Inappropriate Content
box plot and formatting values
Hello
got a box plot chart
the expression is sum(duration)
where duration is a number in minutes
what I want is display in the pop up the min and max values in the form of hh:mm
I tried to update the expression and put num(floor(sum(duration)/60),'00') & ':' & num(mod(sum(duration),60),'00') but this will cause the chart not to be drawn
please advise
- Mark as New
- Bookmark
- Subscribe
- Mute
- Subscribe to RSS Feed
- Permalink
- Report Inappropriate Content
Hi Ali, your expression returns a string, wich can't be located in a plot char, try with this expression:
Interval(Sum(Duration)/1440, 'hh:mm')
This will return a number in the format hh:mm.
- Mark as New
- Bookmark
- Subscribe
- Mute
- Subscribe to RSS Feed
- Permalink
- Report Inappropriate Content
=Interval(Time#(SUM(duration),'mm'),'hh:mm')
- Mark as New
- Bookmark
- Subscribe
- Mute
- Subscribe to RSS Feed
- Permalink
- Report Inappropriate Content
the same this will return string
- Mark as New
- Bookmark
- Subscribe
- Mute
- Subscribe to RSS Feed
- Permalink
- Report Inappropriate Content
this will return a string and the chart will fail to be drawn
- Mark as New
- Bookmark
- Subscribe
- Mute
- Subscribe to RSS Feed
- Permalink
- Report Inappropriate Content
Hi Ali, this is a number with a string representation, QV will now where to locate it, you tried the expression?
- Mark as New
- Bookmark
- Subscribe
- Mute
- Subscribe to RSS Feed
- Permalink
- Report Inappropriate Content
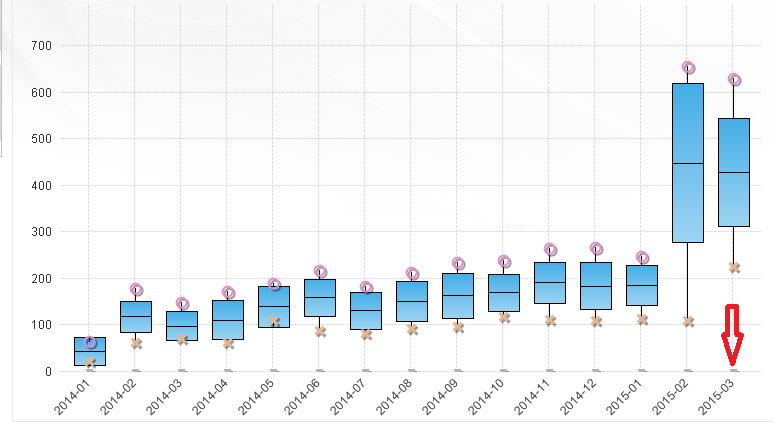
this is where QV is locating your suggested expression
it should be at the X symbol
- Mark as New
- Bookmark
- Subscribe
- Mute
- Subscribe to RSS Feed
- Permalink
- Report Inappropriate Content
And where is expected to be located? if Y-axis should be the minutes you only need Sum(Suration)...for the text reprentation in pop-up when it's different than the value you can use dual function, ie:
Dual(Interval(Sum(Duration)/1440, 'hh:mm'), Sum(Duration))
- Mark as New
- Bookmark
- Subscribe
- Mute
- Subscribe to RSS Feed
- Permalink
- Report Inappropriate Content
what i want is the following
instead of seeing 226 mins; I want to see 3:46
