Unlock a world of possibilities! Login now and discover the exclusive benefits awaiting you.
- Qlik Community
- :
- All Forums
- :
- QlikView App Dev
- :
- Re: bubble size on Scatter chart for geographical...
Options
- Subscribe to RSS Feed
- Mark Topic as New
- Mark Topic as Read
- Float this Topic for Current User
- Bookmark
- Subscribe
- Mute
- Printer Friendly Page
Turn on suggestions
Auto-suggest helps you quickly narrow down your search results by suggesting possible matches as you type.
Showing results for
Not applicable
2014-11-21
04:35 AM
- Mark as New
- Bookmark
- Subscribe
- Mute
- Subscribe to RSS Feed
- Permalink
- Report Inappropriate Content
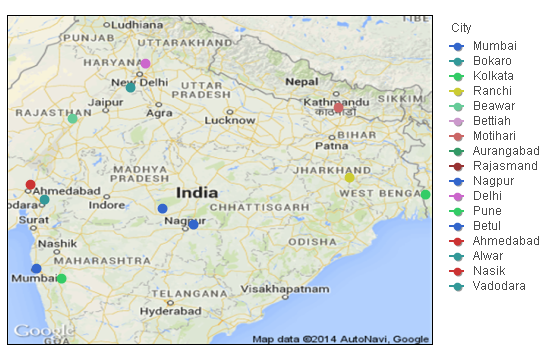
bubble size on Scatter chart for geographical location (Google Map)
Hi i am using Scatter chart to represent geographical location, i want to the size of the bubble will increase or decreas on basis of some expression value.
Kindly help how we can do so.
Thanks in Advance.
Regards,
Jitendra K Vishwakarma
1,064 Views
4 Replies
Not applicable
2014-11-21
06:11 AM
Author
- Mark as New
- Bookmark
- Subscribe
- Mute
- Subscribe to RSS Feed
- Permalink
- Report Inappropriate Content
Can anyone help ??
680 Views
Not applicable
2015-08-06
05:28 AM
Author
- Mark as New
- Bookmark
- Subscribe
- Mute
- Subscribe to RSS Feed
- Permalink
- Report Inappropriate Content
Hi jitendra
hope you got solution,, i also having the same issue. Could you please look into for any help for me/
680 Views
Not applicable
2015-08-07
06:30 AM
Author
- Mark as New
- Bookmark
- Subscribe
- Mute
- Subscribe to RSS Feed
- Permalink
- Report Inappropriate Content
Hi, we did not implemented this because requirement get changed, but i think for sizing the dot size we can use grid chart for same
680 Views
MVP
2015-08-07
06:42 AM
- Mark as New
- Bookmark
- Subscribe
- Mute
- Subscribe to RSS Feed
- Permalink
- Report Inappropriate Content
You can control the size of the bubble by entering expression for Z axis here as shown in image.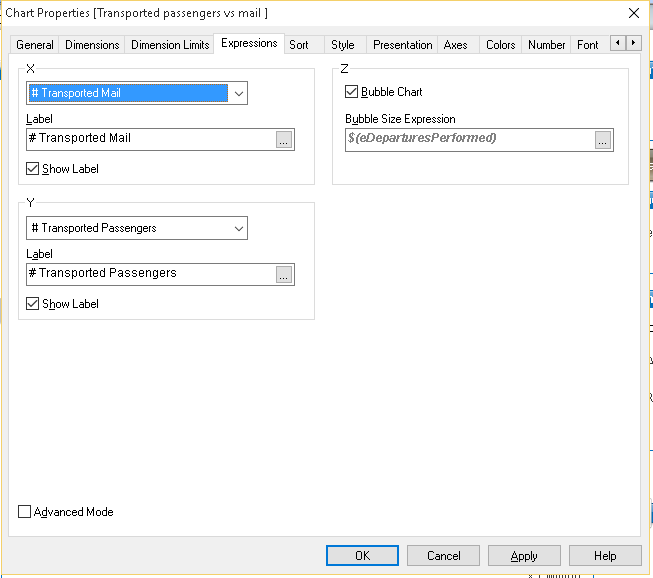
680 Views