Unlock a world of possibilities! Login now and discover the exclusive benefits awaiting you.
- Qlik Community
- :
- All Forums
- :
- QlikView App Dev
- :
- calculated dimension problem
- Subscribe to RSS Feed
- Mark Topic as New
- Mark Topic as Read
- Float this Topic for Current User
- Bookmark
- Subscribe
- Mute
- Printer Friendly Page
- Mark as New
- Bookmark
- Subscribe
- Mute
- Subscribe to RSS Feed
- Permalink
- Report Inappropriate Content
calculated dimension problem
hi ,
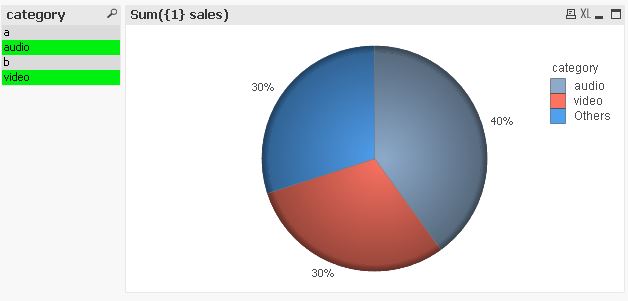
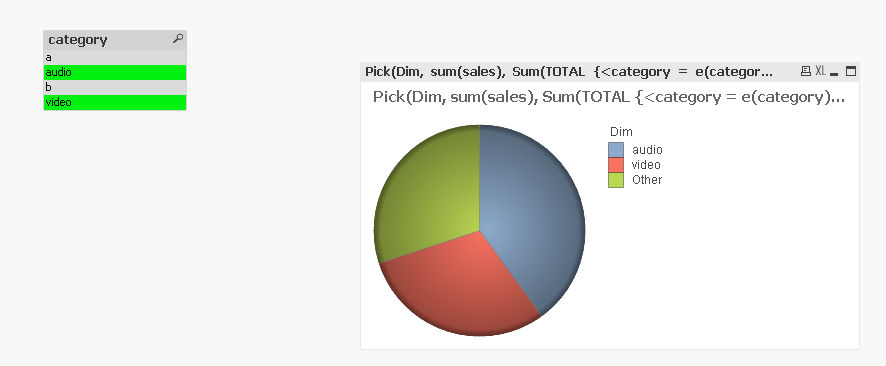
I have requirement I need to display a pie chart based on my selection category and others should group by and should show others in pie chart
For example
LOAD * INLINE [
category, sales
audio, 400
video, 300
a, 200
b, 100
];
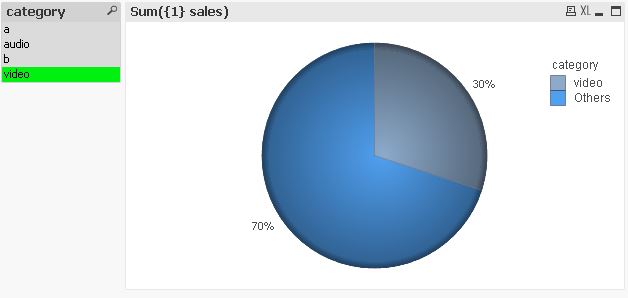
if iam choosing audio and video in list box it should reflect in pie chart like audio ,video and
a,b should be others in pie chart it should groupby the sales and should show others in pie chart
like dynamically need to dimension
Regards
vivek
Accepted Solutions
- Mark as New
- Bookmark
- Subscribe
- Mute
- Subscribe to RSS Feed
- Permalink
- Report Inappropriate Content
Hi,
another solution could be using a dimension limit like:
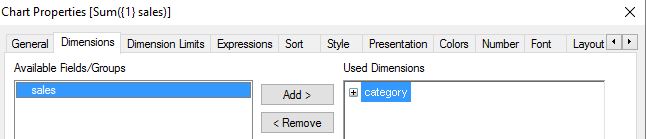
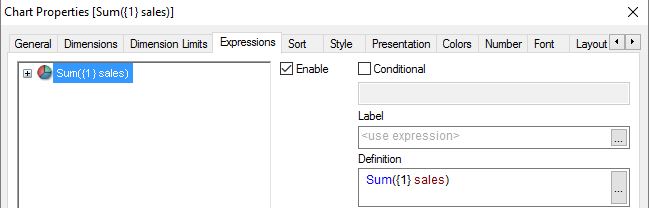
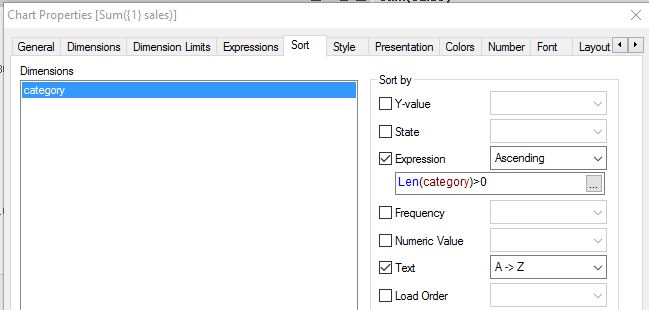
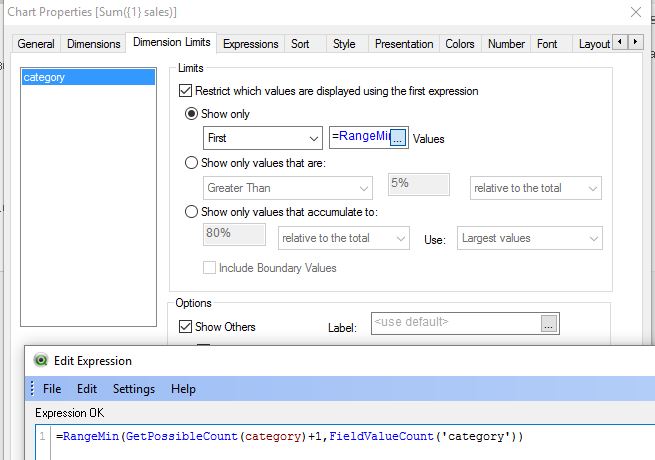
=RangeMin(GetPossibleCount(category)+1,FieldValueCount('category'))
hope this helps
regards
Marco
- Mark as New
- Bookmark
- Subscribe
- Mute
- Subscribe to RSS Feed
- Permalink
- Report Inappropriate Content
Check out the attached:
- Mark as New
- Bookmark
- Subscribe
- Mute
- Subscribe to RSS Feed
- Permalink
- Report Inappropriate Content
Hi,
another solution could be using a dimension limit like:
=RangeMin(GetPossibleCount(category)+1,FieldValueCount('category'))
hope this helps
regards
Marco
- Mark as New
- Bookmark
- Subscribe
- Mute
- Subscribe to RSS Feed
- Permalink
- Report Inappropriate Content
Hi,
Thanks Marco and thanks sunny