Unlock a world of possibilities! Login now and discover the exclusive benefits awaiting you.
- Qlik Community
- :
- All Forums
- :
- QlikView App Dev
- :
- calculated expression in chart graph
- Subscribe to RSS Feed
- Mark Topic as New
- Mark Topic as Read
- Float this Topic for Current User
- Bookmark
- Subscribe
- Mute
- Printer Friendly Page
- Mark as New
- Bookmark
- Subscribe
- Mute
- Subscribe to RSS Feed
- Permalink
- Report Inappropriate Content
calculated expression in chart graph
Trying to create a chart graphic with daily market value of some assets with calculated expressions.
Source data is an excel sheet with date in the first column and market value of the different assets in the next 95 ones (95 assets, so there are a total of 96 columns and hundreds of rows).
I "crosstabled" the excel sheet to easier operate in qlikview.
In the chart graphic I set DATE and ASSET NAME as Dimensions and MARKET VALUE as Expression. That works fine.
The problem comes when I try to create a calculated expression to chart the relative growth of each asset from an specific date (wich I select with a slider variable).
This is the first I tried:
= [MARKET VALUE]/FieldValue('MARKET VALUE',fieldindex('DATE',$(vslider1)))
fieldindex returns the order of the slider selected date (no duplicates), seems correct.
Fieldvalue returns the MARKET VALUE in the indicated position but not for the selected ASSET, so it has no sense.
If I don't crosstable the excel I can make it quite well but I have to create 95 expressions in the chart graphic!
The expression is almost the same:
= [ASSET_1 VALUE]/FieldValue('ASSET_1 VALUE',fieldindex('DATE',$(vslider1)))
¿Is there a way to solve it with the crosstabled version?
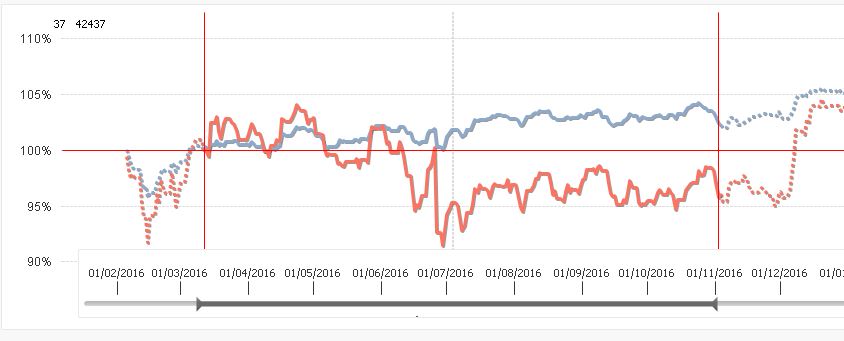
This is how it looks in the non-crosstabled one (wich works fine, but I would have to create 95 expressions in the chart)
Thanks-
Accepted Solutions
- Mark as New
- Bookmark
- Subscribe
- Mute
- Subscribe to RSS Feed
- Permalink
- Report Inappropriate Content
Maybe this as Expression:
= [MARKET_VALUE]/FieldValue(ASSET_NAME,fieldindex('DATE',$(slider1)))
hope this helps
- Mark as New
- Bookmark
- Subscribe
- Mute
- Subscribe to RSS Feed
- Permalink
- Report Inappropriate Content
Would you be able to share a sample and the expected output from the sample you provide? Raw dummy data might work as well... but the main point is to provide the expected output based on the inputs you give us
- Mark as New
- Bookmark
- Subscribe
- Mute
- Subscribe to RSS Feed
- Permalink
- Report Inappropriate Content
Of Course.
I send a .qvw with DEMO DATA.
Main sheet is what I would like to make it work.
I've been trying with this TWO alternatives, but no way
=[MARKET_VALUE]/above(sum(MARKET_VALUE), DATE-$(slider1)) // odd results
=[MARKET_VALUE]/SUM({$<DATE={$(slider1)}>}MARKET_VALUE) // always returns "0"
I've added a second Sheet with the NON CROSSTABLED data.
The graphic is as I would have to get in the main sheet (You would notice both ASSETS begin at 100% from reference date, so it is easy to compare both from a certain date).
Thanks in advance.
- Mark as New
- Bookmark
- Subscribe
- Mute
- Subscribe to RSS Feed
- Permalink
- Report Inappropriate Content
Maybe this as Expression:
= [MARKET_VALUE]/FieldValue(ASSET_NAME,fieldindex('DATE',$(slider1)))
hope this helps
- Mark as New
- Bookmark
- Subscribe
- Mute
- Subscribe to RSS Feed
- Permalink
- Report Inappropriate Content
What removing a single quotation did!!
Thanks for my 3rd day big problem!! Tons o things to learn....