Unlock a world of possibilities! Login now and discover the exclusive benefits awaiting you.
- Qlik Community
- :
- All Forums
- :
- QlikView App Dev
- :
- Re: calculating the result from a formula
- Subscribe to RSS Feed
- Mark Topic as New
- Mark Topic as Read
- Float this Topic for Current User
- Bookmark
- Subscribe
- Mute
- Printer Friendly Page
- Mark as New
- Bookmark
- Subscribe
- Mute
- Subscribe to RSS Feed
- Permalink
- Report Inappropriate Content
calculating the result from a formula
Dear Folks,
I have a table having fields A, B , C, D(codes), I have to create a graph thats shows the codes at x axis and expression which is ((A-C)/A*100) at y axis. The table has different records with same code.
What I want is if i click at any code the graph should calculate the formula for the records having same code.
please guide.
- Mark as New
- Bookmark
- Subscribe
- Mute
- Subscribe to RSS Feed
- Permalink
- Report Inappropriate Content
Hi Farhan,
I'm not sure I follow what your data structure is here. Are A,B,C,D fields or values within a field? If they are fields what values do they contain? Could you post up a snapshot of the table that you are working with and describe in more detail what the graph should show?
- Steve
- Mark as New
- Bookmark
- Subscribe
- Mute
- Subscribe to RSS Feed
- Permalink
- Report Inappropriate Content
by default qlikview will do it....once check your data model...
- Mark as New
- Bookmark
- Subscribe
- Mute
- Subscribe to RSS Feed
- Permalink
- Report Inappropriate Content
- Mark as New
- Bookmark
- Subscribe
- Mute
- Subscribe to RSS Feed
- Permalink
- Report Inappropriate Content
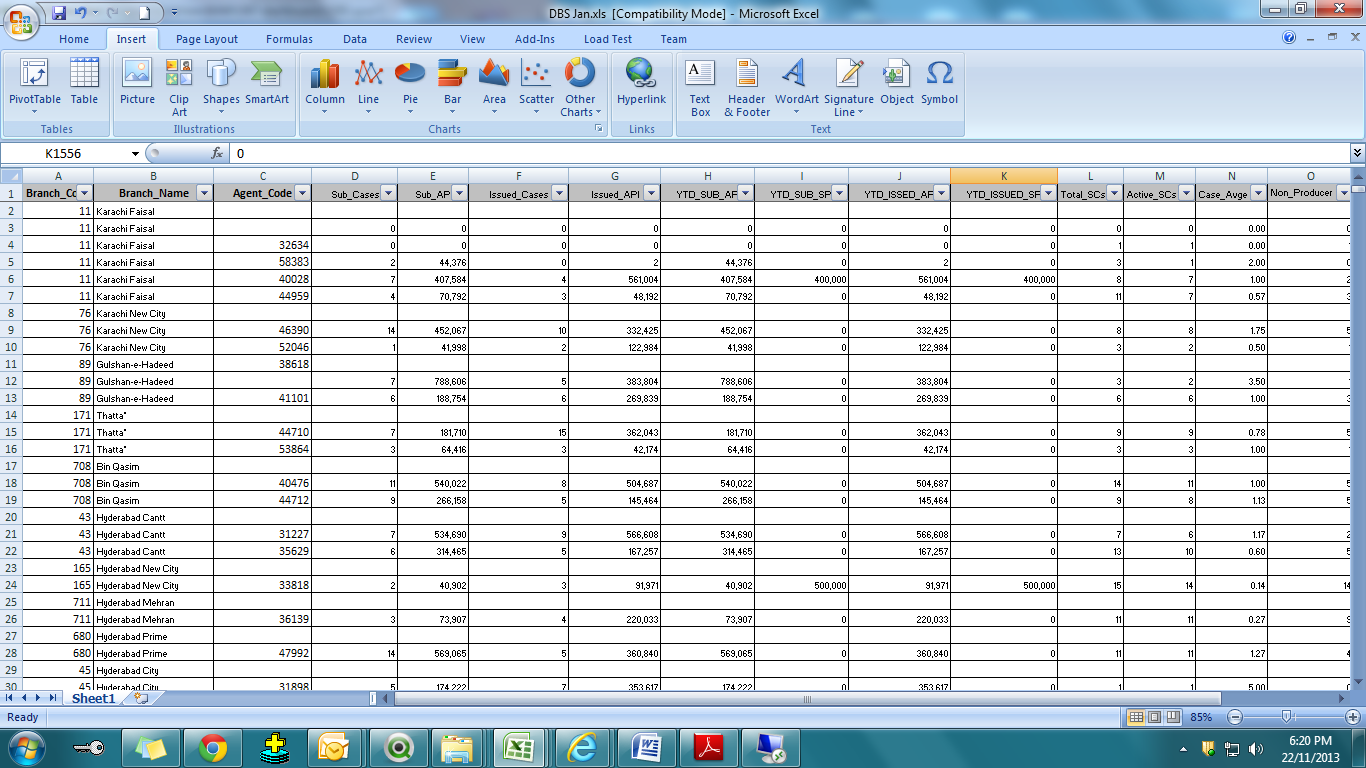
Dear Steve,
attached is the snapshot of table structure, what I want is if I click at a branch code in listbox it should calculate the formula which i have put in a expression.
i have design a straight table but it shows wrong results.
please guide.
- Mark as New
- Bookmark
- Subscribe
- Mute
- Subscribe to RSS Feed
- Permalink
- Report Inappropriate Content
Hi Farhan,
I'm not sure how the data model you have pictured maps on to the expression you gave in your initial post. It sounds like you need to put the branch code in as a dimension and then build your expression based on the numeric fields. What sum is it that you need to calculate based on the column names that you have pictured?
Steve