Unlock a world of possibilities! Login now and discover the exclusive benefits awaiting you.
Announcements
Join us to spark ideas for how to put the latest capabilities into action. Register here!
- Qlik Community
- :
- All Forums
- :
- QlikView App Dev
- :
- Re: change color of max dimension in chart
Options
- Subscribe to RSS Feed
- Mark Topic as New
- Mark Topic as Read
- Float this Topic for Current User
- Bookmark
- Subscribe
- Mute
- Printer Friendly Page
Turn on suggestions
Auto-suggest helps you quickly narrow down your search results by suggesting possible matches as you type.
Showing results for
Creator III
2018-06-10
04:22 AM
- Mark as New
- Bookmark
- Subscribe
- Mute
- Subscribe to RSS Feed
- Permalink
- Report Inappropriate Content
change color of max dimension in chart
Hi all
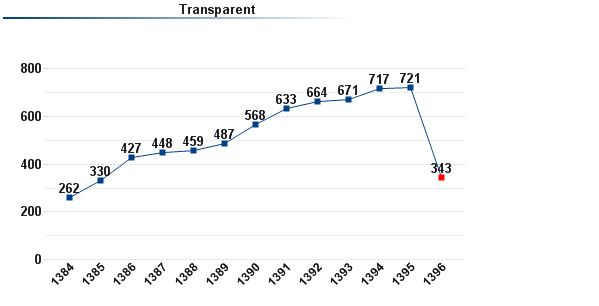
I have a filed that shows years and some chart that dimensions are year and expression is different.
I want to show the expression in last dimension in different color. how can i do that?
when dimension has the last year its ok like this
but when it has not its not work
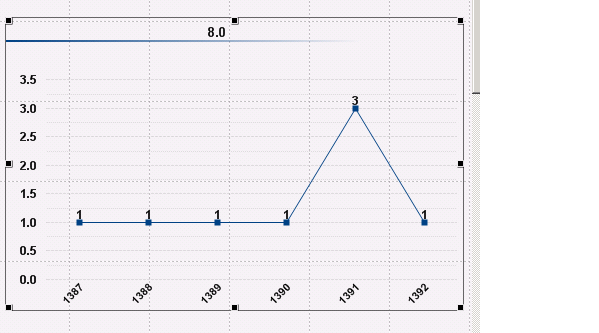
I want that "1" in dimension 1392 would be chang
2,445 Views
- « Previous Replies
-
- 1
- 2
- Next Replies »
15 Replies
MVP
2018-06-11
06:44 AM
- Mark as New
- Bookmark
- Subscribe
- Mute
- Subscribe to RSS Feed
- Permalink
- Report Inappropriate Content
This works with me.
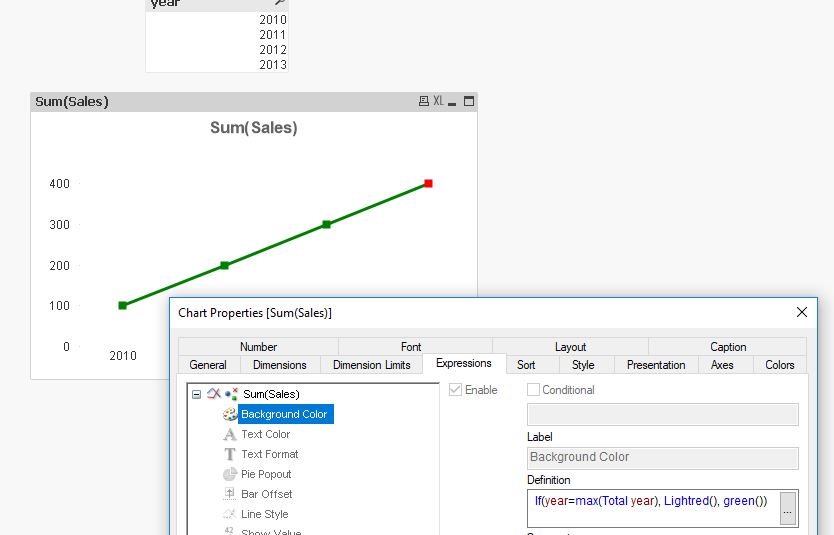
764 Views
Creator III
2018-06-11
06:59 AM
Author
- Mark as New
- Bookmark
- Subscribe
- Mute
- Subscribe to RSS Feed
- Permalink
- Report Inappropriate Content
It works because your dimension is all of data of your field. if dimension be just 2 or 3 value of year it does not work.
means dimension of your chart be 2010, 2011 and 2012.
764 Views
MVP
2018-06-11
07:04 AM
- Mark as New
- Bookmark
- Subscribe
- Mute
- Subscribe to RSS Feed
- Permalink
- Report Inappropriate Content
Could you share your sample?
764 Views
Creator III
2018-06-11
07:18 AM
Author
- Mark as New
- Bookmark
- Subscribe
- Mute
- Subscribe to RSS Feed
- Permalink
- Report Inappropriate Content
yes its my sample
764 Views
MVP
2018-06-11
07:26 AM
- Mark as New
- Bookmark
- Subscribe
- Mute
- Subscribe to RSS Feed
- Permalink
- Report Inappropriate Content
PFA
2,342 Views
Creator III
2018-06-12
03:08 AM
Author
- Mark as New
- Bookmark
- Subscribe
- Mute
- Subscribe to RSS Feed
- Permalink
- Report Inappropriate Content
Thank you for your good answer.
764 Views
- « Previous Replies
-
- 1
- 2
- Next Replies »