Unlock a world of possibilities! Login now and discover the exclusive benefits awaiting you.
- Qlik Community
- :
- All Forums
- :
- QlikView App Dev
- :
- change color to column in a bar chart
- Subscribe to RSS Feed
- Mark Topic as New
- Mark Topic as Read
- Float this Topic for Current User
- Bookmark
- Subscribe
- Mute
- Printer Friendly Page
- Mark as New
- Bookmark
- Subscribe
- Mute
- Subscribe to RSS Feed
- Permalink
- Report Inappropriate Content
change color to column in a bar chart
Hi all,
this is my problem: i want to do a conditional formatting in a bar chart, but i'm not able. I want green column if value is greater than a 38 and red column if value is lower than a 38
thx to all
Accepted Solutions
- Mark as New
- Bookmark
- Subscribe
- Mute
- Subscribe to RSS Feed
- Permalink
- Report Inappropriate Content
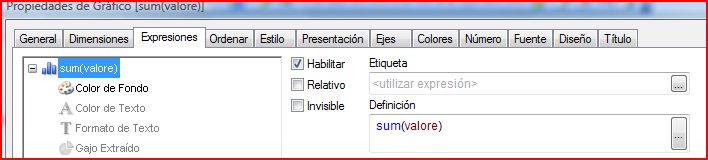
Change your expression to sum(valore)
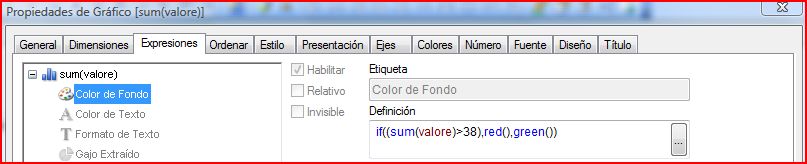
There is a background color option and that is where you put your color logic.
=if((sum(valore)>38),red(),green())
That should do the trick.
- Mark as New
- Bookmark
- Subscribe
- Mute
- Subscribe to RSS Feed
- Permalink
- Report Inappropriate Content
Change your expression to sum(valore)
There is a background color option and that is where you put your color logic.
=if((sum(valore)>38),red(),green())
That should do the trick.
- Mark as New
- Bookmark
- Subscribe
- Mute
- Subscribe to RSS Feed
- Permalink
- Report Inappropriate Content
Hi.
Regards.
- Mark as New
- Bookmark
- Subscribe
- Mute
- Subscribe to RSS Feed
- Permalink
- Report Inappropriate Content
I put the attachment on the reply.
Check it again.
the standard sum goes in the normal expression editor.
- Mark as New
- Bookmark
- Subscribe
- Mute
- Subscribe to RSS Feed
- Permalink
- Report Inappropriate Content
Hi,
See the attached sample file
And let me know
HTH
Regards
Anand